B. The following data shows the satisfaction ratings given by 20 randomly selected customers on services provided by a certain restaurant. Find the mean median and mode. 8 8 8 9 8 9 6 7 9 4 7 10 6 4 6 10
B. The following data shows the satisfaction ratings given by 20 randomly selected customers on services provided by a certain restaurant. Find the mean median and mode. 8 8 8 9 8 9 6 7 9 4 7 10 6 4 6 10

Glencoe Algebra 1, Student Edition, 9780079039897, 0079039898, 2018
18th Edition
ISBN:9780079039897
Author:Carter
Publisher:Carter
Chapter10: Statistics
Section10.1: Measures Of Center
Problem 25PFA

Related questions
Question
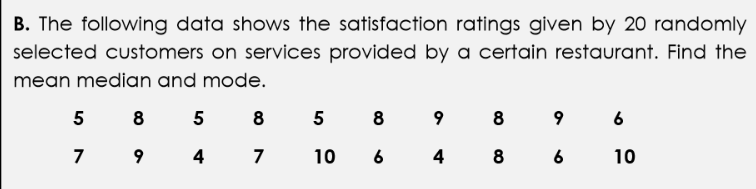
Transcribed Image Text:B. The following data shows the satisfaction ratings given by 20 randomly
selected customers on services provided by a certain restaurant. Find the
mean median and mode.
5 8
5
8 5
8
9
8
9 6
7 9
4
7
10
6
4
8 6
10
Expert Solution
This question has been solved!
Explore an expertly crafted, step-by-step solution for a thorough understanding of key concepts.

This is a popular solution!

Trending now
This is a popular solution!

Step by step
Solved in 2 steps with 2 images

Recommended textbooks for you
Glencoe Algebra 1, Student Edition, 9780079039897…
Algebra
ISBN:
9780079039897
Author:
Carter
Publisher:
McGraw Hill
Glencoe Algebra 1, Student Edition, 9780079039897…
Algebra
ISBN:
9780079039897
Author:
Carter
Publisher:
McGraw Hill