Based on the data from your sample, enter the indicated values in the column on the left below. Round decimal values to three decimal places. When you are done, select "Compute". (In the table below, n is the sample size and the symbol E xy means the sum of the values xy.) n: 11 Sample correlation coefficient (r): x: 0 y: 0 Slope (b,): Exy: 0 y-intercept (bo): Compute (b) Write the equation of the least-squares regression line for your data. Then on the scatter plot for your data, graph this regression equation by plotting two points and then drawing the line through them. Round each coordinate to three decimal places.
Based on the data from your sample, enter the indicated values in the column on the left below. Round decimal values to three decimal places. When you are done, select "Compute". (In the table below, n is the sample size and the symbol E xy means the sum of the values xy.) n: 11 Sample correlation coefficient (r): x: 0 y: 0 Slope (b,): Exy: 0 y-intercept (bo): Compute (b) Write the equation of the least-squares regression line for your data. Then on the scatter plot for your data, graph this regression equation by plotting two points and then drawing the line through them. Round each coordinate to three decimal places.

Glencoe Algebra 1, Student Edition, 9780079039897, 0079039898, 2018
18th Edition
ISBN:9780079039897
Author:Carter
Publisher:Carter
Chapter10: Statistics
Section10.6: Summarizing Categorical Data
Problem 10CYU

Related questions
Question
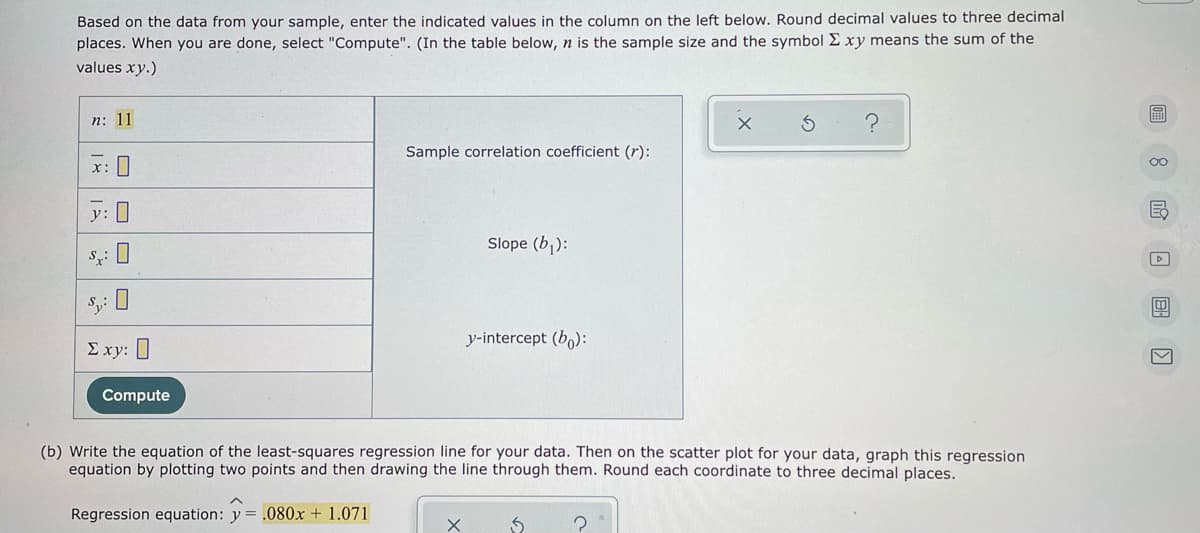
Transcribed Image Text:Based on the data from your sample, enter the indicated values in the column on the left below. Round decimal values to three decimal
places. When you are done, select "Compute". (In the table below, n is the sample size and the symbol E xy means the sum of the
values xy.)
n: 11
Sample correlation coefficient (r):
x: I
00
y: 0
Slope (b,):
S: 0
y-intercept (b,):
Σxy:
Compute
(b) Write the equation of the least-squares regression line for your data. Then on the scatter plot for your data, graph this regression
equation by plotting two points and then drawing the line through them. Round each coordinate to three decimal places.
Regression equation: y = .080x + 1.071
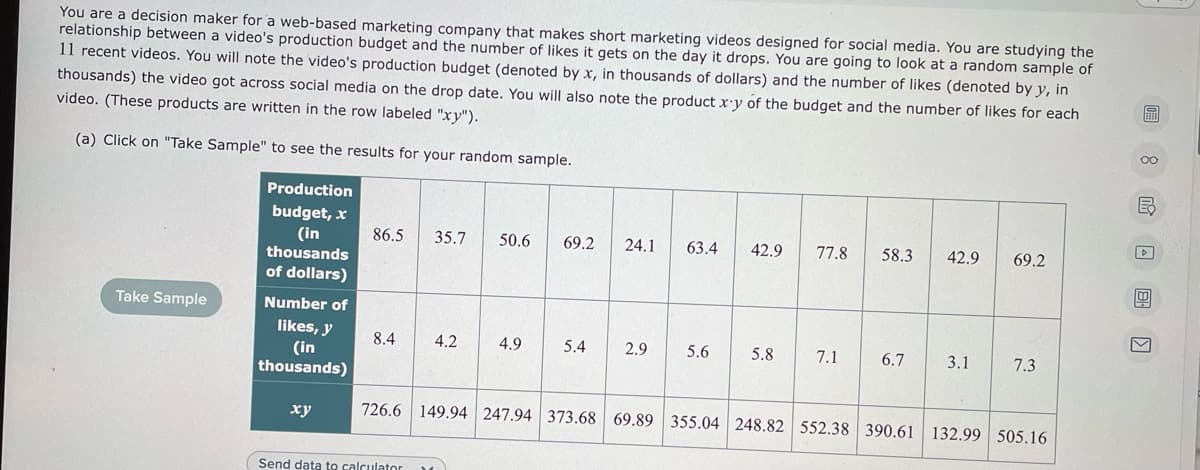
Transcribed Image Text:You are a decision maker for a web-based marketing company that makes short marketing videos designed for social media. You are studying the
relationship between a video's production budget and the number of likes it gets on the day it drops. You are going to look at a random sample of
11 recent videos. You will note the video's production budget (denoted by x, in thousands of dollars) and the number of likes (denoted by y, in
thousands) the video got across social media on the drop date. You will also note the product x'y of the budget and the number of likes for each
圖
video. (These products are written in the row labeled "xy").
00
(a) Click on "Take Sample" to see the results for your random sample.
民
Production
budget, x
(in
86.5
35.7
50.6
69.2
24.1
63.4
42,9
77.8
58.3
42.9
69.2
thousands
of dollars)
Take Sample
Number of
likes, y
8.4
4.2
4.9
5.4
2.9
5.6
5.8
7.1
6.7
3.1
7.3
(in
thousands)
ху
726.6 149.94 247.94 373.68 69.89 355.04 248.82 552.38 390.61 132.99 505.16
Send data to calculator
回 国 回
Expert Solution
This question has been solved!
Explore an expertly crafted, step-by-step solution for a thorough understanding of key concepts.

This is a popular solution!

Trending now
This is a popular solution!

Step by step
Solved in 2 steps with 2 images

Recommended textbooks for you
Glencoe Algebra 1, Student Edition, 9780079039897…
Algebra
ISBN:
9780079039897
Author:
Carter
Publisher:
McGraw Hill

Holt Mcdougal Larson Pre-algebra: Student Edition…
Algebra
ISBN:
9780547587776
Author:
HOLT MCDOUGAL
Publisher:
HOLT MCDOUGAL

College Algebra (MindTap Course List)
Algebra
ISBN:
9781305652231
Author:
R. David Gustafson, Jeff Hughes
Publisher:
Cengage Learning
Glencoe Algebra 1, Student Edition, 9780079039897…
Algebra
ISBN:
9780079039897
Author:
Carter
Publisher:
McGraw Hill
Holt Mcdougal Larson Pre-algebra: Student Edition…
Algebra
ISBN:
9780547587776
Author:
HOLT MCDOUGAL
Publisher:
HOLT MCDOUGAL
College Algebra (MindTap Course List)
Algebra
ISBN:
9781305652231
Author:
R. David Gustafson, Jeff Hughes
Publisher:
Cengage Learning