Based on the data provided below, test the following HO: H₁ = H2= Ha at significance level a= 0.01. Mixture 156 1.12 90 1.07 94 87 78 91 Mixture 3 62 1.08 1.07 99 93 Mixture 2 72 69 a. HO is not rejected at significance level a= 0.01 with F, = 5.33 b. HO is rejected at significance level a = 0.01 with F-5.33 c. HO is rejected at significance level a = 0.01 with F, =0.99 Od. H0 is not rejected at significance level a= 0.01 with F =0.99 e. H0 is not rejected at significance level a= 0.01 with F-5.33 Of. HO is rejected at significance level a=0.01 with F, 2.81 4.59 3.97 4.69 L = 13.25 7 918 794 938
Based on the data provided below, test the following HO: H₁ = H2= Ha at significance level a= 0.01. Mixture 156 1.12 90 1.07 94 87 78 91 Mixture 3 62 1.08 1.07 99 93 Mixture 2 72 69 a. HO is not rejected at significance level a= 0.01 with F, = 5.33 b. HO is rejected at significance level a = 0.01 with F-5.33 c. HO is rejected at significance level a = 0.01 with F, =0.99 Od. H0 is not rejected at significance level a= 0.01 with F =0.99 e. H0 is not rejected at significance level a= 0.01 with F-5.33 Of. HO is rejected at significance level a=0.01 with F, 2.81 4.59 3.97 4.69 L = 13.25 7 918 794 938

Holt Mcdougal Larson Pre-algebra: Student Edition 2012
1st Edition
ISBN:9780547587776
Author:HOLT MCDOUGAL
Publisher:HOLT MCDOUGAL
Chapter11: Data Analysis And Probability
Section: Chapter Questions
Problem 8CR

Related questions
Question
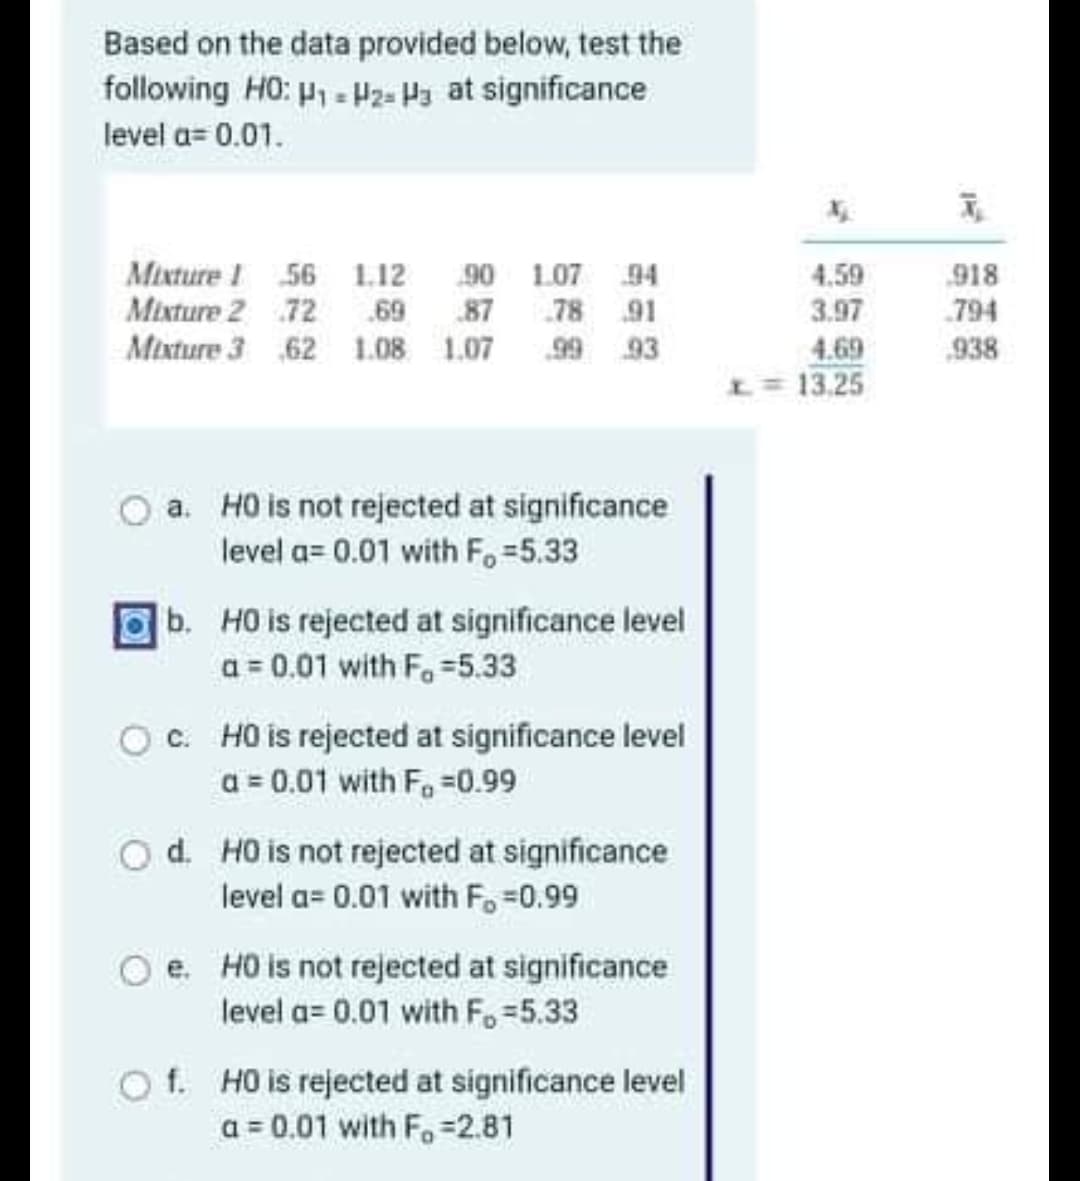
Transcribed Image Text:Based on the data provided below, test the
following HO: P₁ = H2= P₂ at significance
level a= 0.01.
Mixture 156
1.12
Mixture 2 72
90 1.07 94
69 87 78 91
Mixture 3 62 1.08 1.07 99 93
a. HO is not rejected at significance
level a= 0.01 with F, =5.33
b. HO is rejected at significance level
a = 0.01 with F, -5.33
c. HO is rejected at significance level
a = 0.01 with F, =0.99
d. HO is not rejected at significance
level a= 0.01 with F, -0.99
e. HO is not rejected at significance
level a= 0.01 with F₂=5.33
Of. HO is rejected at significance level
a = 0.01 with F, 2.81
4.59
3.97
4.69
L = 13.25
21
918
794
938
Expert Solution
This question has been solved!
Explore an expertly crafted, step-by-step solution for a thorough understanding of key concepts.

Step by step
Solved in 2 steps with 1 images

Recommended textbooks for you
Holt Mcdougal Larson Pre-algebra: Student Edition…
Algebra
ISBN:
9780547587776
Author:
HOLT MCDOUGAL
Publisher:
HOLT MCDOUGAL
Holt Mcdougal Larson Pre-algebra: Student Edition…
Algebra
ISBN:
9780547587776
Author:
HOLT MCDOUGAL
Publisher:
HOLT MCDOUGAL