Based on the density graph below, what is the probability of a value in the sample space being anywhere from 60 to 80? -0.07 -0.06 0.05 0.04
Based on the density graph below, what is the probability of a value in the sample space being anywhere from 60 to 80? -0.07 -0.06 0.05 0.04

Glencoe Algebra 1, Student Edition, 9780079039897, 0079039898, 2018
18th Edition
ISBN:9780079039897
Author:Carter
Publisher:Carter
Chapter10: Statistics
Section10.1: Measures Of Center
Problem 9PPS

Related questions
Question
A. 25%
B. 75%
C. 50%
D. 100%
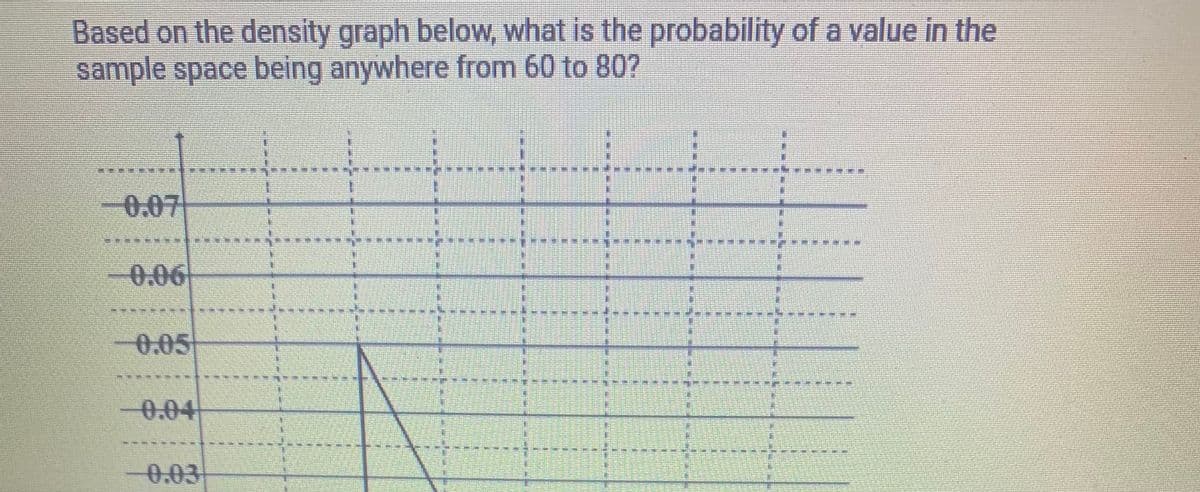
Transcribed Image Text:Based on the density graph below, what is the probability of a value in the
sample space being anywhere from 60 to 80?
0.07
*********.
0.06
-0.05
-0.04
0.03
23
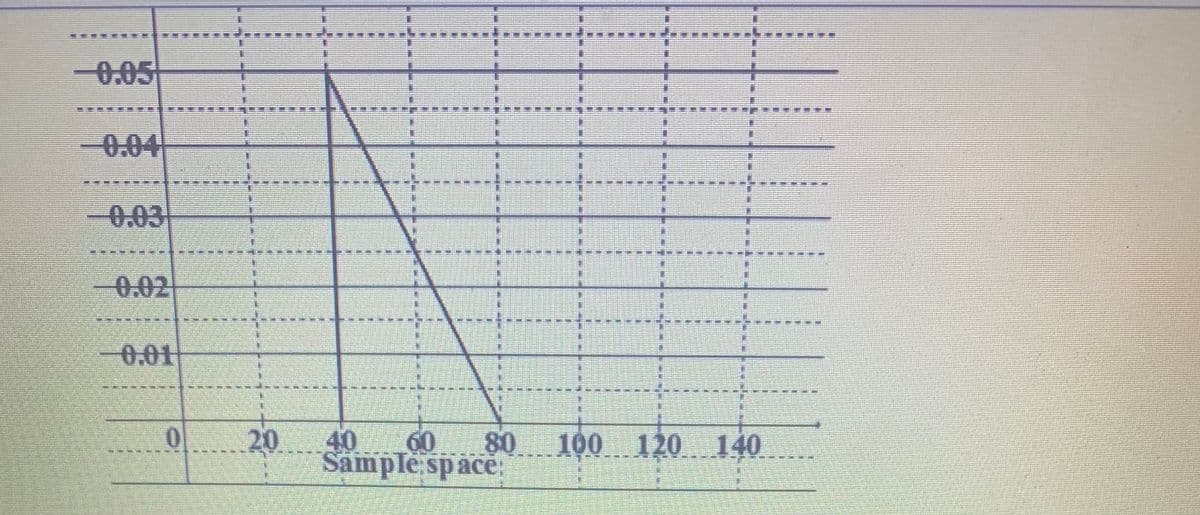
Transcribed Image Text:一0:05
0.04
主
0.03
0.02
-0.01
0.
20
40
60
80
100
120 140
Sample space:
主
%23
技进 茲術
Expert Solution
This question has been solved!
Explore an expertly crafted, step-by-step solution for a thorough understanding of key concepts.

This is a popular solution!

Trending now
This is a popular solution!

Step by step
Solved in 2 steps

Recommended textbooks for you
Glencoe Algebra 1, Student Edition, 9780079039897…
Algebra
ISBN:
9780079039897
Author:
Carter
Publisher:
McGraw Hill

Mathematics For Machine Technology
Advanced Math
ISBN:
9781337798310
Author:
Peterson, John.
Publisher:
Cengage Learning,
Glencoe Algebra 1, Student Edition, 9780079039897…
Algebra
ISBN:
9780079039897
Author:
Carter
Publisher:
McGraw Hill
Mathematics For Machine Technology
Advanced Math
ISBN:
9781337798310
Author:
Peterson, John.
Publisher:
Cengage Learning,