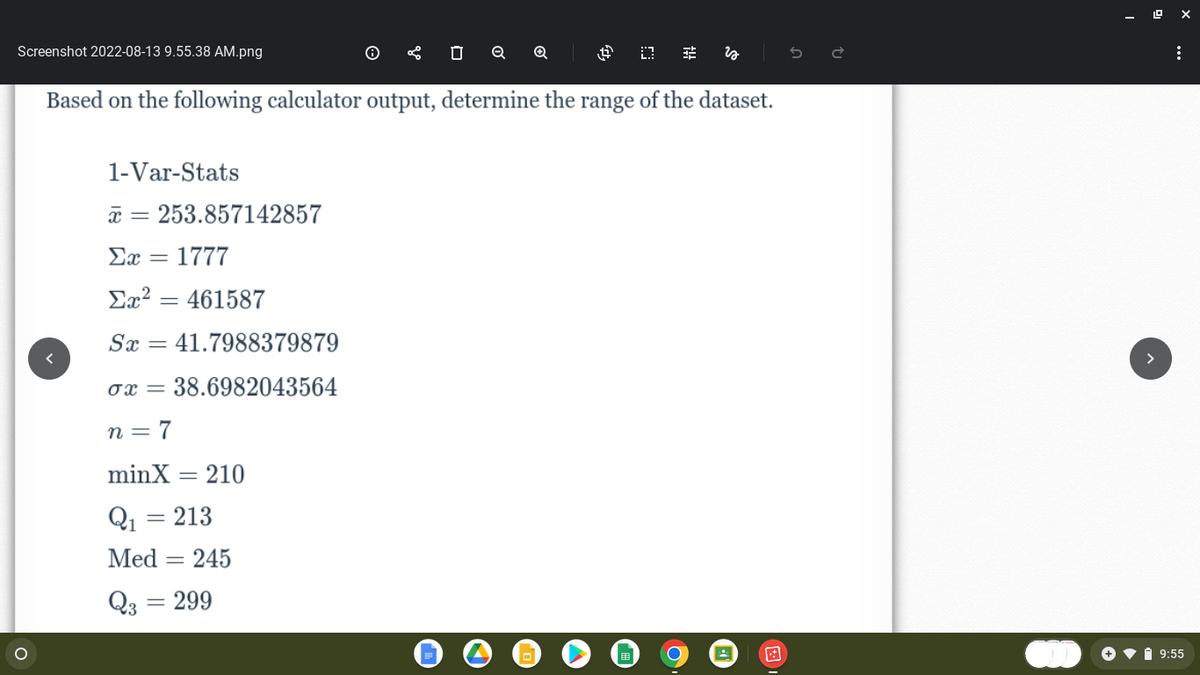
Based on the following calculator output, determine the range of the dataset. 1-Var-Stats x = 253.857142857 Σæ = 1777 Σχ2 = 461587 Sx 41.7988379879 = σχ= 38.6982043564 n=7 minX= 210 Q₁ = 213 Med 245 Q3 = 299


Q: Identify the lower class limits, upper class limits, class width, class midpoints, and class…
A:
Q: TL.. Which of the following random variables is discrete? (A) the length of time a battery lasts (B)…
A:
Q: Let X₁, X2, X3, Xn be a random sample of n from population X distributed with the foll probability…
A: Solution
Q: Waiting times (in minutes) of customers at a bank where all customers enter a single waiting line…
A: Given The two sets of datasets are Bank A 6.4,6.5,6.7,6.8,7.0,7.3,7.6,7.6,7.8 and Bank B…
Q: If the standard error of the sample mean is 5, for samples of size 25, what is the popu lation…
A:
Q: Find the area of the shaded region under the standard normal distribution to the left of the given…
A: The given shaded region is -2.12.
Q: Problem 2 Suppose that X and Y are independent and Z=X+Y. Find fz if Ae -fre fx(x) = if z > 0…
A:
Q: oportion under the area under the normal curve below -1.2
A: Given: Mean of standard normal μ=0 Standard deviation σ=1 X ~ N(0,1)
Q: QUESTION 28 Suppose your estimated MLR model is: Y_hat = -30 + 2*X1 + 10*X2 Suppose the standard…
A: A) option 1 is correct. The reason behind is that when we multiply CA by 5 (rescaled) then , the…
Q: Given that a data set has a mean of 40 and a standard deviation of 4, find the percent of data…
A: Given that Mean = M = 40 Standard deviation = SD = 4
Q: The mean age of principals in a local school district is 50.7 years. If a hypothesis test is…
A: Given Mean = 50.7
Q: Some researchers developing a new intelligence test are trying to decide the maximum time to allow…
A: From the given histogram we can see that there are 7 data points between 500 sec and 700 sec, 9 data…
Q: Which of the following random variables is continuous?
A: A variable is said to be continuous if it can take any value in an specified interval.
Q: hua went to a doctor's appointment yesterday. He was weighed and the paperwork said that his weight…
A: Percentile is the measure of quantiles. It divide the data into 100 equal parts with 99 points.…
Q: a) Suppose that X₁, X2, X3.....X₁ is a random sample of n from population X which has a chi- square…
A: Given Xi~chi square distribution with one degree of freedom, and they are random sample…
Q: A dairy claims that the mean amount in their milk containers is 128 ounces. Let X be the number of…
A: Given Information: Mean μ=128 Standard deviation σ=1 X be the number of ounces of milk per…
Q: When are p-values negative? when the sample statistic is smaller than the hypothesizec ) never )…
A: Given that P-value Calculated using statistics.
Q: A population consists of the following three values: 4, 5, and 6. a) Carry out a sampling with…
A: It is given that Population : 4, 5, 6 Population size N = 3 Sample size n = 2
Q: Problem Set: Chapter 14 Correlation and Regression years in college by asking them how many hours of…
A: Given Information: Student Course work hours per class 1 7 2 5 3 4 4 4 The line in…
Q: When Brooklyn commutes to work, the amount of time it takes her to arrive is normally distributed…
A: Given that. X~N( μ , ?^2 ) μ=54 , ?=4 Z-score =( x - μ )/?
Q: Q13: If X₁, X2, ..., X7 is a random sample of size 7 from a uniform distribution U(0,0). Calculate…
A: It is given that Xi, i = 1,2,...,7 follows Uniform(a = 0 and b = θ).
Q: Provided below are summary statistics for independent simple random samples from two populations.…
A: From the provided information,
Q: Question 29
A: Confidence interval is the measure of parameter. It explain the range of interval where the…
Q: Soledad and Tania are both high school students. The number of texts Soledad sends daily, S, is…
A:
Q: Acrylic bone cement is sometimes used in hip and knee replacements to fix an artificial joint in…
A: Given that mean =306.17,s.d =41.96 ,n =8 ,alpha=0.05 Find 95% confidence interval.
Q: 19. Which of the following is true about a 95% confidence interval of the mean of a given sample: a)…
A:
Q: 5.a) Find the number of men getting wages between Rs. 5 and Rs. 35 from the following table: Wages…
A: Given: Wages No of men 0-10 9 10-20 30 20-30 35 30-40 42
Q: Each person in a random sample of 228 male teenagers and a random sample of 303 female teenagers was…
A: Given information: x¯Male=15.3, sMale=11.3, nMale=228x¯Female=14.1, sFemale=11.8, nFemale=303
Q: under the area under the normal curve between the mean and +2.
A: Given: Mean of standard normal distribution μ=0 Standard deviation of normal distribution σ=1 Let X…
Q: Hygiene of handshakes, high five and fist bumps. Health professionals warn that transmission of…
A: Given: The mean of Hygiene of handshakes, high five and fist bumps, Handshake 131 74 129 96 92…
Q: Calculate the standard error for a sample mean when the population standard deviation is 250.1 and…
A:
Q: How do I interpret the mean 12.5 and the median 12.5 and explain how the mean and the median each…
A: Given: Mean=12.5Median=12.5
Q: Source Between Within Total SS df MS F N/A
A: To test, the null and alternative hypotheses: Ho : Three programs produce same result Ha : At least…
Q: Perform a chi-square independence test, provided the conditions for using the test are met.…
A: Chi-square Analysis: For assessing categorical data from a randomly selected sample, the statistical…
Q: Use the given degree of confidence and sample data to construct a confidence interval for the…
A: Mean = 158 Standard deviation = 17.6 Sample size = 12
Q: The p-value is: (to 2 decimals) Based on this we: Fail to reject the null hypothesis Reject the…
A: Given that Sample size n =25 Sample mean =1.97 Standard deviation =0.06
Q: Assuming that the scores of the student in a test are normally distributed with the mean of 40 and…
A: We have given that Mean(µ) = 40Standard deviations (σ) = 6X ~ N (µ, σ )= N(40, 6)
Q: Goodness-of-Fit: Conduct the specified goodness-of-fit test. Benford's Law states the probability…
A: Given that We have to conduct hypothesis testing for whether the distribution follows the…
Q: Consider the output on a chi-square test listed below. How would you explain the results to someone…
A: Note: As it is required to explain the results using the the output on the chi-square test, we have…
Q: A real estate developer wishes to study the relationship between the size of home a client will…
A: Hint: Performed in Excel and explaining with screenshot.
Q: which of the following random variables isn't discrete? (a) the number of children in a family (b)…
A: The random variable which takes only specific values like whole number or integer is called discrete…
Q: 2. In the third round of the NCAA basketball tournament there are 16 teams remaining. If the…
A: Binomial distribution is the type of discrete distribution. It has two outcome only. In this…
Q: e answers options: 2 and 1?
A: The Simple Linear Regression model is Y = b0 + b1*X1 + u and the Multiple Linear Regression…
Q: The value ofr for 20 pairs of observations of two variables is-7. What is the possible value of R²…
A: Since you have asked multiple question, we will solve the first question for you. If you want any…
Q: In an article about unusual allergies, a doctor explained that allergy to sulfites is usually seen…
A:
Q: A chi-square distribution with 12 degrees of freedom is graphed below. The region under the curve to…
A: The question is about chi square dist. Given : df = 12 To find : Shaded area to right of point x =…
Q: Select all of the characteristics of a standard Normal distribution. Question options:…
A: Given that Standard normal distribution
Q: Suppose that a particular candidate for public office is in fact favored by 48% of all registered…
A:
Q: On a standardized exam, the scores are normally distributed with a mean of 39 and a standard…
A:


Trending now
This is a popular solution!

Step by step
Solved in 2 steps

- COVID-19 (novel corona virus) took the world by surprise in late 2019. By early 2020, nearly all countries worldwide were affected. Early reports have claimed that a large percentage of those infected with the corona virus were asymptomatic (showed no symptoms of the virus). The rate of asymptomatic infections is important, since such people can unwittingly spread the virus to those around them. Suppose the Centers for Disease Control and Prevention (CDC) needs to estimate the proportion of the infected population that is also asymptomatic. A random sample of 1445 infected patients is examined and 275 are observed to be asymptomatic . Determine the point estimate, and the sample standard deviation, hat p Round the sample proportion to four decimal places and round the standard deviation to six decimal places , if necessary. hat p = Box; a_{p} = Using a 98% confidence level, determine the margin of error , E, and a confidence interval for the proportion of all patients who are infected…COVID-19 (novel corona virus) took the world by surprise in late 2019. By early 2020, nearly all countries worldwide were affected.Early reports have claimed that a large percentage of those infected with the corona virus were asymptomatic (showed no symptoms of the virus). The rate of asymptomatic infections is important, since such people can unwittingly spread the virus to those around them.Suppose the U.S. Centers for Disease Control and Prevention (CDC) needs to estimate the proportion of the infected population that is also asymptomatic. A random sample of 1075 infected patients is examined and 169 are observed to be asymptomatic.Determine the point estimate, ˆpp^ and the sample standard deviation, sˆpsp^. Round the sample proportion to four decimal places and round the standard deviation to six decimal places, if necessary. p^= sp^=Using a 96% confidence level, determine the margin of error, EE, and a confidence interval for the proportion of all patients who are infected with…COVID-19 (novel corona virus) took the world by surprise in late 2019. By early 2020, nearly all countries worldwide were affected. Early reports have claimed that a large percentage of those infected with the corona virus were asymptomatic (showed no symptoms of the virus). The rate of asymptomatic infections is important, since such people can unwittingly spread the virus to those around them. Suppose the U.S. Centers for Disease Control and Prevention (CDC) needs to estimate the proportion of the infected population that is also asymptomatic. A random sample of 1145 infected patients is examined and 139 are observed to be asymptomatic. Determine the point estimate, p^ and the sample standard deviation, sˆp^. Round the sample proportion to four decimal places and round the standard deviation to six decimal places, if necessary. p with the ^on top of p= s p with the ^ on top of p = Using a 97% confidence level, determine the margin of error, E, and a confidence interval for the…
- COVID-19 (novel corona virus) took the world by surprise in late 2019. By early 2020, nearly all countries worldwide were affected.Early reports have claimed that a large percentage of those infected with the corona virus were asymptomatic (showed no symptoms of the virus). The rate of asymptomatic infections is important, since such people can unwittingly spread the virus to those around them.Suppose the U.S. Centers for Disease Control and Prevention (CDC) needs to estimate the proportion of the infected population that is also asymptomatic. A random sample of 1500 infected patients is examined and 382 are observed to be asymptomatic.Determine the point estimate, ˆp and the sample standard deviation, sˆp. Round the sample proportion to four decimal places and round the standard deviation to six decimal places, if necessary.ˆp=sˆp=Using a 95% confidence level, determine the margin of error, E, and a confidence interval for the proportion of all patients who are infected with the…The goal of a ________ is to explain the relationship between observed phenomena, without necessarily being directly testable. datum theory hypothesis quantitative studyEndocrinology In Section 2.10, we described Data Set BONEDEN.DAT concerning the effect of tobacco use on BMD. Note: 2.38-2.40 Involve computing a new variable C. Compute C using the formula given and then use STATA to produce the output requested. 2.38. For each pair of twins, compute the following for the lumbar spine: A = BMD for the heavier-smoking twin − BMD for the lighter-smoking twin = x1 − x2 B = mean BMD for the twinship = (x1 + x2)/2 C = 100% × (A/B) Derive appropriate descriptive statistics for C over the entire study population. 2.39. Suppose we group the twin pairs according to the difference in tobacco use expressed in 10 pack-year groups (0–9.9 pack-years/10–19.9 pack-years/20–29.9 pack-years/30–39.9 pack-years/40+ pack-years). Compute appropriate descriptive statistics, and provide a scatterplot for C grouped by the difference in tobacco use in pack-years 2.40. What impression do you have of the relationship between BMD and tobacco use based on Problem 2.39?
- Question 12 Do You Own a Smartphone?A study1 conducted in July 2015 examines smartphone ownership by US adults. A random sample of 2001 people were surveyed, and the study shows that 688 of the 989 men own a smartphone and 671 of the 1012 women own a smartphone. We want to test whether the survey results provide evidence of a difference in the proportion owning a smartphone between men and women.Let group 1 be US men and let group 2 be US women.Click here to access StatKey.1Anderson M, "The Demographics of Device Ownership," pewresearch.org, October 29, 2015. (a) State the null and alternative hypotheses. Your answer should be an expression composed of symbols: =,≠,<,>,μ,μ1,μ2,p,p1,p2,ρ,p^,p^1,p^2,r. H0: vs Ha:Edit (b) Give the notation for the sample statistic. p1-p2 p^1-p^2 μ1-μ2 x-1-x-2 ρ1-ρ2 r1-r2…CD4 cells are carried in the blood as part of the human immune system. One of the effects of the HIV virus is that these cells die. In this study of the effectiveness of a new anti-viral drug on HIV, 20 HIV-positive patients had their CD4 counts recorded (“Baseline”) and then were put on a course of treatment with this drug. After using the drug for one year, their CD4 counts were again recorded (“OneYear”). The aim was to show that patients taking the drug had increased CD4 counts which is not generally seen in HIV-positive patients. Baseline OneYear 2.12 2.47 4.35 4.61 3.39 5.26 2.51 3.02 4.04 6.36 5.1 5.93 3.77 3.93 3.35 4.09 4.1 4.88 3.35 3.81 4.15 4.74 3.56 3.29 3.39 5.55 1.88 2.82 2.56 4.23 2.96 3.23 2.49 2.56 3.03 4.31 2.66 4.37 3.00 2.40 1) What is the correlation between baseline and one year CD4 counts?Attack rate for influenza by age andtreatment group age QIV group Control group 3-4 3.78% 5.69% 5-8 1.70% 0.15% Suppose that 80% of 3–4-year-old children and 70% of 5–8-year-old children in a village are vaccinated with QIV vaccine. Also assume that children who are not vaccinated have twice the incidence of influenza as the control group in Table. What % of 3–4-year-old children in the village will get influenza? (Hint: Use the law of total probability. P(B)=P(B|A1) x P(A1) + P(B|A2) x P(A2) ) What % of 5–8-year-old children in the village will get influenza? (Hint: Use the law of total probability. P(B)=P(B|A1) x P(A1) + P(B|A2) x P(A2) )
- Overweight participants who lose money when they don’t meet a specific exercise goal meet the goal more often, on average, than those who win money when they meet the goal, even if the final result is the same financially. In particular, participants who lost money met the goal for an average of 45.0 days (out of 100) while those winning money or receiving other incentives met the goal for an average of 33.7 days. The incentive does make a difference. In this exercise, we ask how big the effect is between the two types of incentives. Find a 90% confidence interval for the difference in mean number of days meeting the goal, between people who lose money when they don't meet the goal and those who win money or receive other similar incentives when they do meet the goal. The standard error for the difference in means from a bootstrap distribution is 4.14.Murder was committed in an air-conditioned laboratory. Dr. Quincy, the medical examiner, was summoned to the scene of the crime. One of the first things he did was to take the temperature of the corpse. At 9:23 PM, he recorded the temperature to be 20.1oC and at 9:53 Pm to be 18.7oC. He further observed that the thermostat of the air-conditioning unit was set at 16oC. After gathering all pertinent data and analyzing them for sometime, he submitted a preliminary report stating that the victim was murdered between 7 PM and 8 PM. Was Dr. Quincy's report correct? At what approximate time did the victim die? Assume that the normal body temperature of a human being, alive and well, is 37oC.One of the markers of toxicity of a proposed drug during drug development is loss of weight in the exposed individuals. Female was exposed to a proposed drug and the effects were observed during a 28 days period. Another record only the vehicle. These two groups were animals of similar age and gender and were all treated in similar ways regarding nutrition, water and environment. Result of the weight of 16 male mice before and after treatment are tabulated in table 2 below: Table 2: Table of the weights (gm) of 16 male mice before (X1a) and after treatment (X1b) X1a 20 21.2 20.6 19.5 18.9 20.2 21 19.6 17.8 18.5 18.3 19.2 19.6 19.4 19.2 19 X1b 20.9 21.9 21.2 21 19.9 20.9 21.8 21 18.6 19.9 19 20 20.1 20 20 20.7 Determine if these was a statistical weight difference (gain/loss in the 2 groups) Using paired t-test
