Provided below are summary statistics for independent simple random samples from two populations. Use the pooled t-test and the pooled t-interval procedure to conduct the required hypothesis test and obtain the specified confidence interval. x₁ =20,s₁ = 5, n₁ = 20, x₂ = 24, s₂ = 6, n₂ = 14 a. Left-tailed test, α = 0.05 b. 90% confidence interval a. What are the correct hypotheses for a left-tailed test? OA. Ho: H₁
Provided below are summary statistics for independent simple random samples from two populations. Use the pooled t-test and the pooled t-interval procedure to conduct the required hypothesis test and obtain the specified confidence interval. x₁ =20,s₁ = 5, n₁ = 20, x₂ = 24, s₂ = 6, n₂ = 14 a. Left-tailed test, α = 0.05 b. 90% confidence interval a. What are the correct hypotheses for a left-tailed test? OA. Ho: H₁

MATLAB: An Introduction with Applications
6th Edition
ISBN:9781119256830
Author:Amos Gilat
Publisher:Amos Gilat
Chapter1: Starting With Matlab
Section: Chapter Questions
Problem 1P

Related questions
Question
Since the P-value is
than
▼
greateror
equal or less
α,
▼
do not rejector
reject
H0.
b. The
to
90%
confidence interval is from
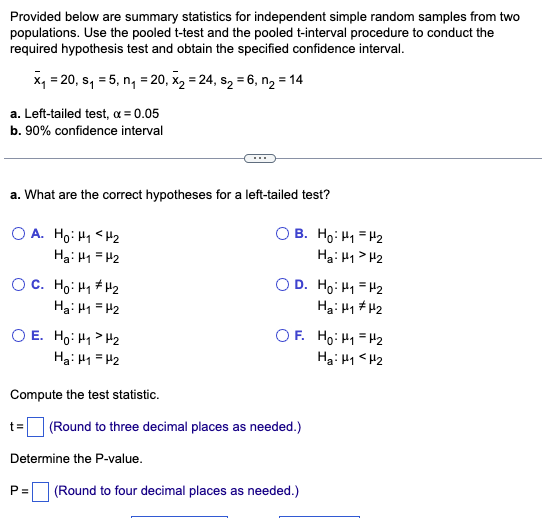
Transcribed Image Text:Provided below are summary statistics for independent simple random samples from two
populations. Use the pooled t-test and the pooled t-interval procedure to conduct the
required hypothesis test and obtain the specified confidence interval.
x₁ =20, s₁ = 5, n₁ = 20, x₂ = 24, s₂ = 6, n₂ = 14
a. Left-tailed test, α = 0.05
b. 90% confidence interval
a. What are the correct hypotheses for a left-tailed test?
OA. Ho: H₁ <H₂2
Ha: H1 H₂
OC. Ho: H₁ H₂
Ha: H1 H₂
B. Ho: H₁
Ha: H1
Determine the P-value.
OD. Ho: H₁
Ha: H1
OE. Ho: H₁ H₂
Ha: H1 H2
Compute the test statistic.
t= (Round to three decimal places as needed.)
H₂
H2
OF. Ho: H₁ H₂
Ha: H1 <H₂
P= (Round to four decimal places as needed.)
H₂
H₂
Expert Solution
This question has been solved!
Explore an expertly crafted, step-by-step solution for a thorough understanding of key concepts.

Step by step
Solved in 6 steps with 6 images

Recommended textbooks for you
MATLAB: An Introduction with Applications
Statistics
ISBN:
9781119256830
Author:
Amos Gilat
Publisher:
John Wiley & Sons Inc

Probability and Statistics for Engineering and th…
Statistics
ISBN:
9781305251809
Author:
Jay L. Devore
Publisher:
Cengage Learning

Statistics for The Behavioral Sciences (MindTap C…
Statistics
ISBN:
9781305504912
Author:
Frederick J Gravetter, Larry B. Wallnau
Publisher:
Cengage Learning
MATLAB: An Introduction with Applications
Statistics
ISBN:
9781119256830
Author:
Amos Gilat
Publisher:
John Wiley & Sons Inc
Probability and Statistics for Engineering and th…
Statistics
ISBN:
9781305251809
Author:
Jay L. Devore
Publisher:
Cengage Learning
Statistics for The Behavioral Sciences (MindTap C…
Statistics
ISBN:
9781305504912
Author:
Frederick J Gravetter, Larry B. Wallnau
Publisher:
Cengage Learning

Elementary Statistics: Picturing the World (7th E…
Statistics
ISBN:
9780134683416
Author:
Ron Larson, Betsy Farber
Publisher:
PEARSON

The Basic Practice of Statistics
Statistics
ISBN:
9781319042578
Author:
David S. Moore, William I. Notz, Michael A. Fligner
Publisher:
W. H. Freeman

Introduction to the Practice of Statistics
Statistics
ISBN:
9781319013387
Author:
David S. Moore, George P. McCabe, Bruce A. Craig
Publisher:
W. H. Freeman