Problem Set: Chapter 14 Correlation and Regression years in college by asking them how many hours of course work they do for each class in a typical week. A sample of four students provides the following data on year in college and hours of course work per class: Student 1 2 3 4 HOURS 10 Year in College Freshman (1) Sophomore (2) Junior (3) Senior (4) A scatter plot of the sample data is shown here (blue circle symbols). The line Y = -2X + 9 is shown in orange. 0 O O Course Work Hours per Class 2 YEAR 5 4 4 O D A 0 Sum of Distances + (Mx, My) (?)
Problem Set: Chapter 14 Correlation and Regression years in college by asking them how many hours of course work they do for each class in a typical week. A sample of four students provides the following data on year in college and hours of course work per class: Student 1 2 3 4 HOURS 10 Year in College Freshman (1) Sophomore (2) Junior (3) Senior (4) A scatter plot of the sample data is shown here (blue circle symbols). The line Y = -2X + 9 is shown in orange. 0 O O Course Work Hours per Class 2 YEAR 5 4 4 O D A 0 Sum of Distances + (Mx, My) (?)

College Algebra
7th Edition
ISBN:9781305115545
Author:James Stewart, Lothar Redlin, Saleem Watson
Publisher:James Stewart, Lothar Redlin, Saleem Watson
Chapter1: Equations And Graphs
Section: Chapter Questions
Problem 8P: Noise and Intelligibility Audiologists study the intelligibility of spoken sentences under different...

Related questions
Question
J 1
Transcribed Image Text:Is
ing
Problem Set: Chapter 14 Correlation and Regression
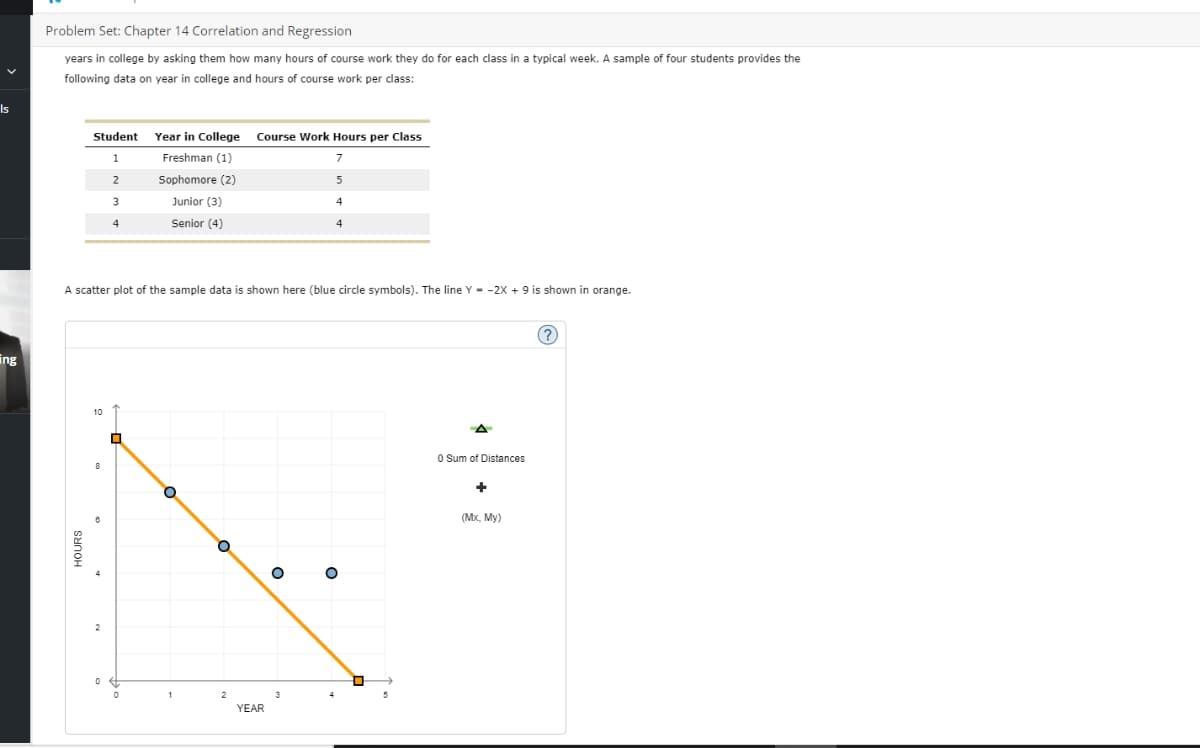
years in college by asking them how many hours of course work they do for each class in a typical week. A sample of four students provides the
following data on year in college and hours of course work per class:
Student
1
2
3
4
10
Year in College
Freshman (1)
Sophomore (2)
Junior (3)
Senior (4)
A scatter plot of the sample data is shown here (blue circle symbols). The line Y-2X + 9 is shown in orange.
□
Course Work Hours per Class
7
5
4
4
O
YEAR
O
D
A
1.
0 Sum of Distances
+
(Mx, My)
(?)
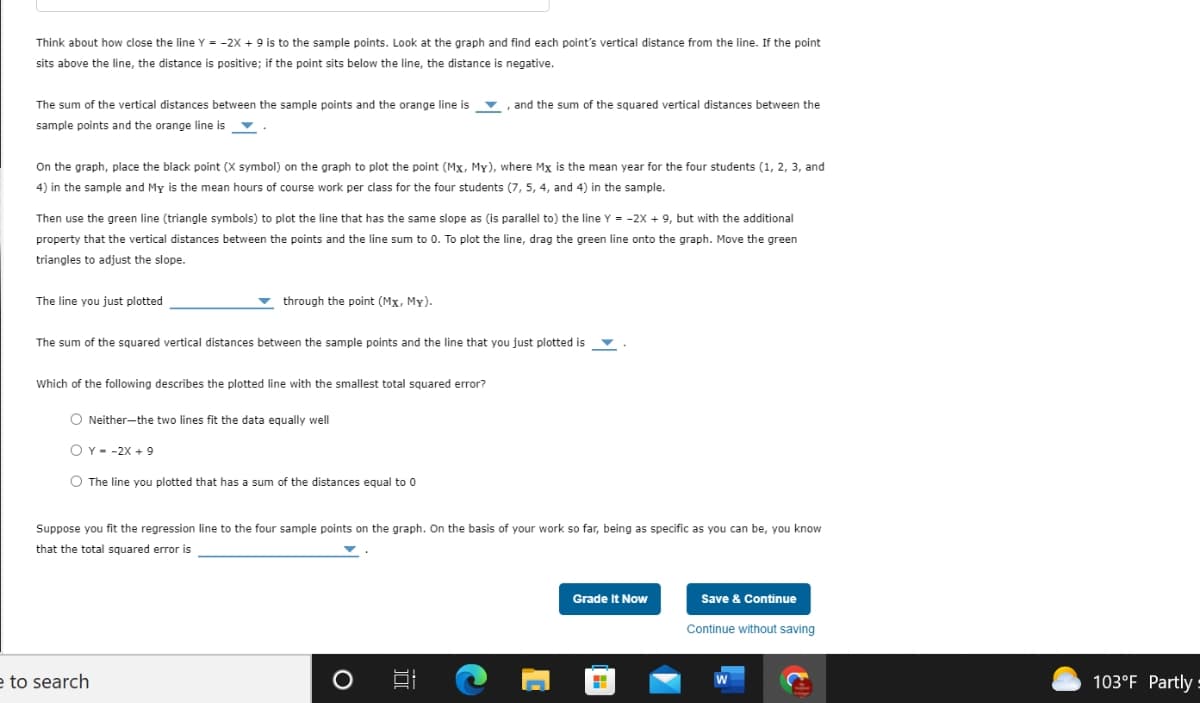
Transcribed Image Text:Think about how close the line Y = -2X + 9 is to the sample points. Look at the graph and find each point's vertical distance from the line. If the point
sits above the line, the distance is positive; if the point sits below the line, the distance is negative.
The sum of the vertical distances between the sample points and the orange line is, and the sum of the squared vertical distances between the
sample points and the orange line is .
On the graph, place the black point (X symbol) on the graph to plot the point (Mx, My), where Mx is the mean year for the four students (1, 2, 3, and
4) in the sample and My is the mean hours of course work per class for the four students (7, 5, 4, and 4) in the sample.
Then use the green line (triangle symbols) to plot the line that has the same slope as (is parallel to) the line Y = -2X + 9, but with the additional
property that the vertical distances between the points and the line sum to 0. To plot the line, drag the green line onto the graph. Move the green
triangles to adjust the slope.
The line you just plotted
through the point (Mx, My).
The sum of the squared vertical distances between the sample points and the line that you just plotted is
Which of the following describes the plotted line with the smallest total squared error?
ONeither-the two lines fit the data equally well
O Y = -2X + 9
O The line you plotted that has a sum of the distances equal to 0
Suppose you fit the regression line to the four sample points on the graph. On the basis of your work so far, being as specific as you can be, you know
that the total squared error is
e to search
O
DI
Grade It Now
H
Save & Continue
Continue without saving
103°F Partly=
Expert Solution
This question has been solved!
Explore an expertly crafted, step-by-step solution for a thorough understanding of key concepts.

This is a popular solution!

Trending now
This is a popular solution!

Step by step
Solved in 2 steps

Recommended textbooks for you
College Algebra
Algebra
ISBN:
9781305115545
Author:
James Stewart, Lothar Redlin, Saleem Watson
Publisher:
Cengage Learning

Functions and Change: A Modeling Approach to Coll…
Algebra
ISBN:
9781337111348
Author:
Bruce Crauder, Benny Evans, Alan Noell
Publisher:
Cengage Learning

Glencoe Algebra 1, Student Edition, 9780079039897…
Algebra
ISBN:
9780079039897
Author:
Carter
Publisher:
McGraw Hill
College Algebra
Algebra
ISBN:
9781305115545
Author:
James Stewart, Lothar Redlin, Saleem Watson
Publisher:
Cengage Learning
Functions and Change: A Modeling Approach to Coll…
Algebra
ISBN:
9781337111348
Author:
Bruce Crauder, Benny Evans, Alan Noell
Publisher:
Cengage Learning
Glencoe Algebra 1, Student Edition, 9780079039897…
Algebra
ISBN:
9780079039897
Author:
Carter
Publisher:
McGraw Hill

Big Ideas Math A Bridge To Success Algebra 1: Stu…
Algebra
ISBN:
9781680331141
Author:
HOUGHTON MIFFLIN HARCOURT
Publisher:
Houghton Mifflin Harcourt