Based on the given diagram The green broken line defines the pahse diagrma of solution Shows the increase of boiling boiling point of the solvent when in solution Shows a phase diagram of another solvent Shows a lower freezing temperature of solvent in solution only I is correct All are correct I, III, IV is correct I, II and III is correct
Based on the given diagram The green broken line defines the pahse diagrma of solution Shows the increase of boiling boiling point of the solvent when in solution Shows a phase diagram of another solvent Shows a lower freezing temperature of solvent in solution only I is correct All are correct I, III, IV is correct I, II and III is correct

Physical Chemistry
2nd Edition
ISBN:9781133958437
Author:Ball, David W. (david Warren), BAER, Tomas
Publisher:Ball, David W. (david Warren), BAER, Tomas
Chapter6: Equilibria In Single-component Systems
Section: Chapter Questions
Problem 6.66E

Related questions

Question
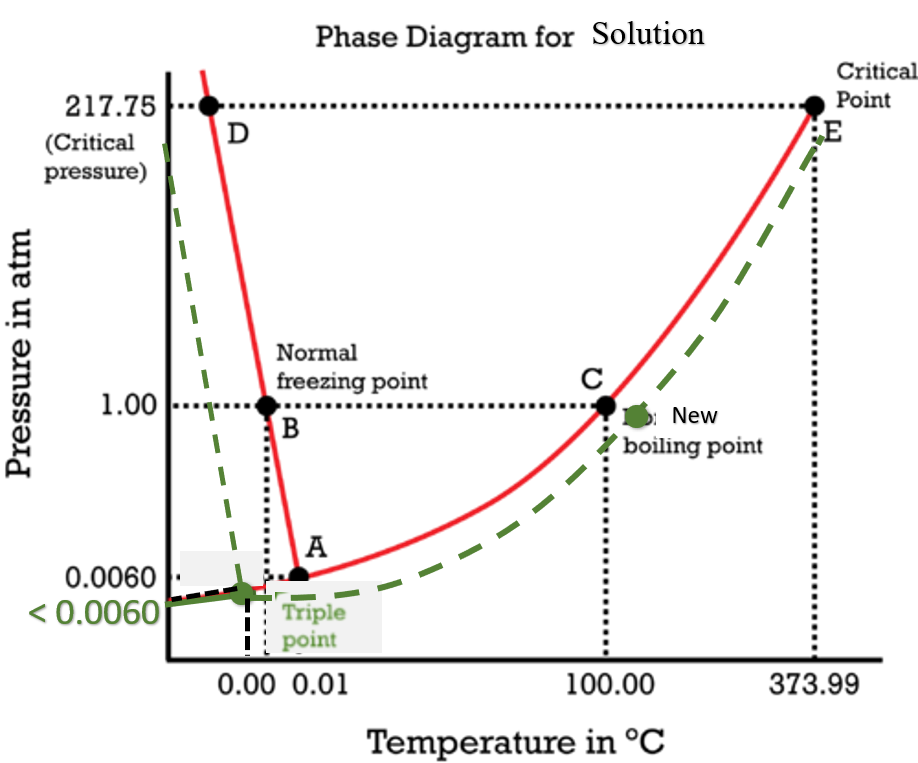
Based on the given diagram
- The green broken line defines the pahse diagrma of solution
- Shows the increase of boiling boiling point of the solvent when in solution
- Shows a phase diagram of another solvent
- Shows a lower freezing temperature of solvent in solution
|
only I is correct |
||
|
All are correct |
||
|
I, III, IV is correct |
||
|
I, II and III is correct |
Transcribed Image Text:Phase Diagram for Solution
Critical
Point
217.75
D
(Critical
pressure)
Normal
freezing point
C
1.00
New
В
boiling point
A
0.0060
< 0.0060
Triple
point
0.00 0.01
100.00
373.99
Temperature in °C
Pressure in atm
Expert Solution
This question has been solved!
Explore an expertly crafted, step-by-step solution for a thorough understanding of key concepts.

Step by step
Solved in 2 steps

Knowledge Booster


Learn more about
Need a deep-dive on the concept behind this application? Look no further. Learn more about this topic, chemistry and related others by exploring similar questions and additional content below.Recommended textbooks for you
Physical Chemistry
Chemistry
ISBN:
9781133958437
Author:
Ball, David W. (david Warren), BAER, Tomas
Publisher:
Wadsworth Cengage Learning,
Physical Chemistry
Chemistry
ISBN:
9781133958437
Author:
Ball, David W. (david Warren), BAER, Tomas
Publisher:
Wadsworth Cengage Learning,