Based on the information in the table below, which model seems to be the most appropriate for predicting pull strength? Consider adj R² values that are greater than 70% to be acceptable. Note: the linear correlation coefficient for die height and wire length is 0.378. Model R2 Adjusted R Regression P-value Predictors Die Height 24% 21% 0.0123 I3D Wire Length 96% 96% 4.24E-18 Die Height & Wire Length 98% 98% 1.075E-19 II - Model I Select I is the most appropriate for predicting pull strength. For the next two statements, the first one should have the lower model number and the second one should have the higher model number. If you do it the opposite way round it will be marked incorrect. Choose reasons from the ones listed below the statements. - Model I Select was eliminated because I Select I - Model I Select 1 was eliminated because I Select I A the R° is very low B. the R2 is very high C. the adj R? is very low D. the adj R2 is very high E. the adj R2 is almost the same as the adj R² of the model that was selected as the most appropriate model, but it has more predictors F. the adj R2 is almost the same as the adj R2 of the model that was selected as the most appropriate model, but it has fewer predictors
Based on the information in the table below, which model seems to be the most appropriate for predicting pull strength? Consider adj R² values that are greater than 70% to be acceptable. Note: the linear correlation coefficient for die height and wire length is 0.378. Model R2 Adjusted R Regression P-value Predictors Die Height 24% 21% 0.0123 I3D Wire Length 96% 96% 4.24E-18 Die Height & Wire Length 98% 98% 1.075E-19 II - Model I Select I is the most appropriate for predicting pull strength. For the next two statements, the first one should have the lower model number and the second one should have the higher model number. If you do it the opposite way round it will be marked incorrect. Choose reasons from the ones listed below the statements. - Model I Select was eliminated because I Select I - Model I Select 1 was eliminated because I Select I A the R° is very low B. the R2 is very high C. the adj R? is very low D. the adj R2 is very high E. the adj R2 is almost the same as the adj R² of the model that was selected as the most appropriate model, but it has more predictors F. the adj R2 is almost the same as the adj R2 of the model that was selected as the most appropriate model, but it has fewer predictors

College Algebra
7th Edition
ISBN:9781305115545
Author:James Stewart, Lothar Redlin, Saleem Watson
Publisher:James Stewart, Lothar Redlin, Saleem Watson
Chapter1: Equations And Graphs
Section: Chapter Questions
Problem 8P: Noise and Intelligibility Audiologists study the intelligibility of spoken sentences under different...

Related questions

Topic Video
Question
Options for part 1: I, II, III
Options for part 2: (I, II, III), and (A,B,C,D,E, and F)
Options for part 3: (I, II, III), and (A,B, C,D, E, and F)
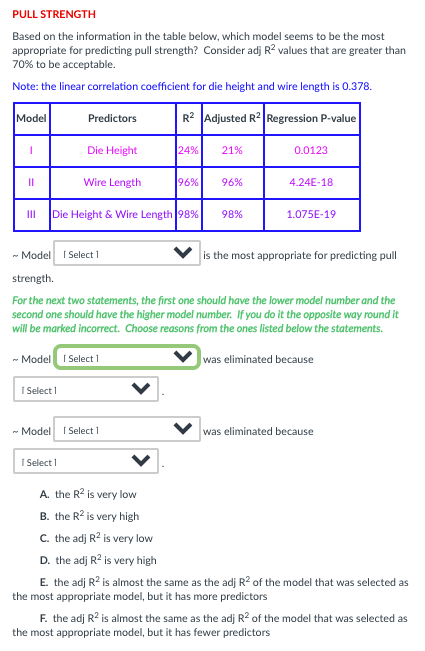
Transcribed Image Text:PULL STRENGTH
Based on the information in the table below, which model seems to be the most
appropriate for predicting pull strength? Consider adj R? values that are greater than
70% to be acceptable.
Note: the linear correlation coefficient for die height and wire length is 0.378.
Model
Predictors
R2 Adjusted R2 Regression P-value
Die Height
24%
21%
0.0123
Wire Length
96%
96%
4.24E-18
II
Die Height & Wire Length 98%
98%
1.075E-19
- Model
I Select 1
is the most appropriate for predicting pull
strength.
For the next two statements, the first one should have the lower model number and the
second one should have the higher model number. If you do it the opposite way round it
will be marked incorrect. Choose reasons from the ones listed below the statements.
- Model I Select I
was eliminated because
I Select 1
- Model
I Select 1
was eliminated because
I Select 1
A. the R2 is very low
B. the R2 is very high
C. the adj R2 is very low
D. the adj R2 is very high
E. the adj R2 is almost the same as the adj R² of the model that was selected as
the most appropriate model, but it has more predictors
F. the adj R2 is almost the same as the adj R2 of the model that was selected as
the most appropriate model, but it has fewer predictors
-
Expert Solution
This question has been solved!
Explore an expertly crafted, step-by-step solution for a thorough understanding of key concepts.

This is a popular solution!

Trending now
This is a popular solution!

Step by step
Solved in 3 steps

Knowledge Booster


Learn more about
Need a deep-dive on the concept behind this application? Look no further. Learn more about this topic, statistics and related others by exploring similar questions and additional content below.Recommended textbooks for you
College Algebra
Algebra
ISBN:
9781305115545
Author:
James Stewart, Lothar Redlin, Saleem Watson
Publisher:
Cengage Learning

Algebra and Trigonometry (MindTap Course List)
Algebra
ISBN:
9781305071742
Author:
James Stewart, Lothar Redlin, Saleem Watson
Publisher:
Cengage Learning

Big Ideas Math A Bridge To Success Algebra 1: Stu…
Algebra
ISBN:
9781680331141
Author:
HOUGHTON MIFFLIN HARCOURT
Publisher:
Houghton Mifflin Harcourt
College Algebra
Algebra
ISBN:
9781305115545
Author:
James Stewart, Lothar Redlin, Saleem Watson
Publisher:
Cengage Learning
Algebra and Trigonometry (MindTap Course List)
Algebra
ISBN:
9781305071742
Author:
James Stewart, Lothar Redlin, Saleem Watson
Publisher:
Cengage Learning
Big Ideas Math A Bridge To Success Algebra 1: Stu…
Algebra
ISBN:
9781680331141
Author:
HOUGHTON MIFFLIN HARCOURT
Publisher:
Houghton Mifflin Harcourt

Glencoe Algebra 1, Student Edition, 9780079039897…
Algebra
ISBN:
9780079039897
Author:
Carter
Publisher:
McGraw Hill

Holt Mcdougal Larson Pre-algebra: Student Edition…
Algebra
ISBN:
9780547587776
Author:
HOLT MCDOUGAL
Publisher:
HOLT MCDOUGAL