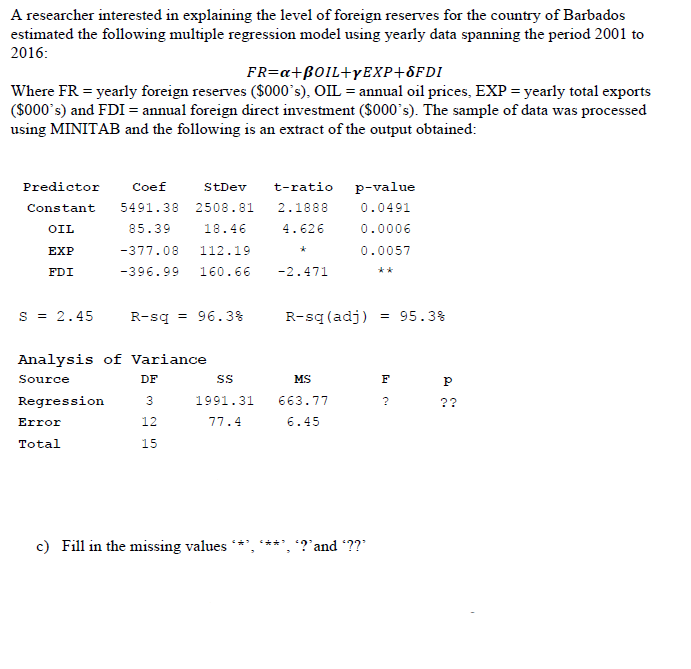
A researcher interested in explaining the level of foreign reserves for the country of Barbados estimated the following multiple regression model using yearly data spanning the period 2001 to 2016: FR=a+B0IL+YEXP+8FDI Where FR = yearly foreign reserves ($000's), OIL = annual oil prices, EXP = yearly total exports ($000's) and FDI = annual foreign direct investment ($000`s). The sample of data was processed using MINITAB and the following is an extract of the output obtained: Predictor Coef StDev t-ratio p-value Constant 5491.38 2508.81 2.1888 0.0491 OIL 85.39 18.46 4.626 0.0006 EXP -377.08 112.19 0.0057 FDI -396.99 160.66 -2.471 s = 2.45 R-sq = 96.3% R-sq (adj) = 95.3% Analysis of Variance Source DF ss MS F Regression 3 1991.31 663.77 ?? 12 41.רר 6.45 Error Total 15 c) Fill in the missing values **** '?'and ??"
Correlation
Correlation defines a relationship between two independent variables. It tells the degree to which variables move in relation to each other. When two sets of data are related to each other, there is a correlation between them.
Linear Correlation
A correlation is used to determine the relationships between numerical and categorical variables. In other words, it is an indicator of how things are connected to one another. The correlation analysis is the study of how variables are related.
Regression Analysis
Regression analysis is a statistical method in which it estimates the relationship between a dependent variable and one or more independent variable. In simple terms dependent variable is called as outcome variable and independent variable is called as predictors. Regression analysis is one of the methods to find the trends in data. The independent variable used in Regression analysis is named Predictor variable. It offers data of an associated dependent variable regarding a particular outcome.

Step by step
Solved in 3 steps


