Consider a linear regression model that relates school expenditures and family background to student performance in Massachusetts using 224 school districts. The response variable is the mean score on the MCAS (Massachusetts Comprehensive Assessment System) exam given in May 1998 to 10th-graders. Four explanatory variables are used: (1) STR is the student-to-teacher ratio, (2) TSAL is the average teacher’s salary, (3) INC is the median household income, and (4) SGL is the percentage of single family households. The Excel Regression output for the sample regression equation is given below. (a) What proportion of the variation in MCAS score is explained by the explanatory variables? (b) At the 5% level, are the explanatory variables jointly significant in explaining MCAS score? Explain briefly. (c) At the 5% level, which variables are individually significant at predicting MCAS score? Explain briefly. (d) Suppose a second regression model (Model 2) was generated using only the variables STR, INC, and SGL. For that model Which model is better, Model 2 or Model 1, the model given above in the table with explanatory variables STR, INC, TSAL, SGL? Explain briefly.


Correlation
Correlation defines a relationship between two independent variables. It tells the degree to which variables move in relation to each other. When two sets of data are related to each other, there is a correlation between them.
Linear Correlation
A correlation is used to determine the relationships between numerical and categorical variables. In other words, it is an indicator of how things are connected to one another. The correlation analysis is the study of how variables are related.
Regression Analysis
Regression analysis is a statistical method in which it estimates the relationship between a dependent variable and one or more independent variable. In simple terms dependent variable is called as outcome variable and independent variable is called as predictors. Regression analysis is one of the methods to find the trends in data. The independent variable used in Regression analysis is named Predictor variable. It offers data of an associated dependent variable regarding a particular outcome.
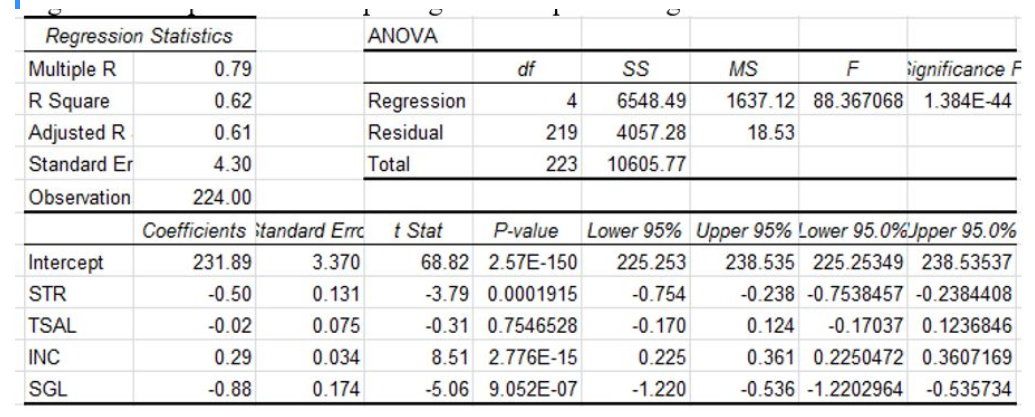
Consider a linear regression model that relates school expenditures and family background to student performance in Massachusetts using 224 school districts. The response variable is the mean score on the MCAS (Massachusetts Comprehensive Assessment System) exam given in May 1998 to 10th-graders. Four explanatory variables are used: (1) STR is the student-to-teacher ratio, (2) TSAL is the average teacher’s salary, (3) INC is the median household income, and (4) SGL is the percentage of single family households. The Excel Regression output for the sample regression equation is given below.
(a) What proportion of the variation in MCAS score is explained by the explanatory variables?
(b) At the 5% level, are the explanatory variables jointly significant in explaining MCAS score? Explain briefly.
(c) At the 5% level, which variables are individually significant at predicting MCAS score? Explain briefly.
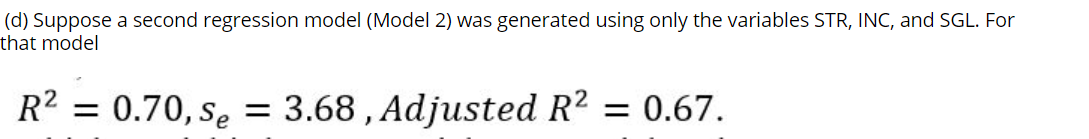
(d) Suppose a second regression model (Model 2) was generated using only the variables STR, INC, and SGL. For that model
Which model is better, Model 2 or Model 1, the model given above in the table with explanatory variables STR, INC, TSAL, SGL? Explain briefly.


Trending now
This is a popular solution!

Step by step
Solved in 2 steps


