Construct a scatter plot for the waistline and neckline using the data presented What does the scatter plot tell you about the sign of the slope of the regression equation? (positive or negative) 1-2. Estimate the regression line of neckline and waistline. Using the model, we wish to estimate the waistline given information about the neckline. Solve for the y/ intercept, a and the slope, b. Round off final answers to two decimal places. a = b = 3-4. The regression equation is: Waistline' = neckline
Construct a scatter plot for the waistline and neckline using the data presented What does the scatter plot tell you about the sign of the slope of the regression equation? (positive or negative) 1-2. Estimate the regression line of neckline and waistline. Using the model, we wish to estimate the waistline given information about the neckline. Solve for the y/ intercept, a and the slope, b. Round off final answers to two decimal places. a = b = 3-4. The regression equation is: Waistline' = neckline

Holt Mcdougal Larson Pre-algebra: Student Edition 2012
1st Edition
ISBN:9780547587776
Author:HOLT MCDOUGAL
Publisher:HOLT MCDOUGAL
Chapter11: Data Analysis And Probability
Section11.4: Collecting Data
Problem 3E

Related questions
Question
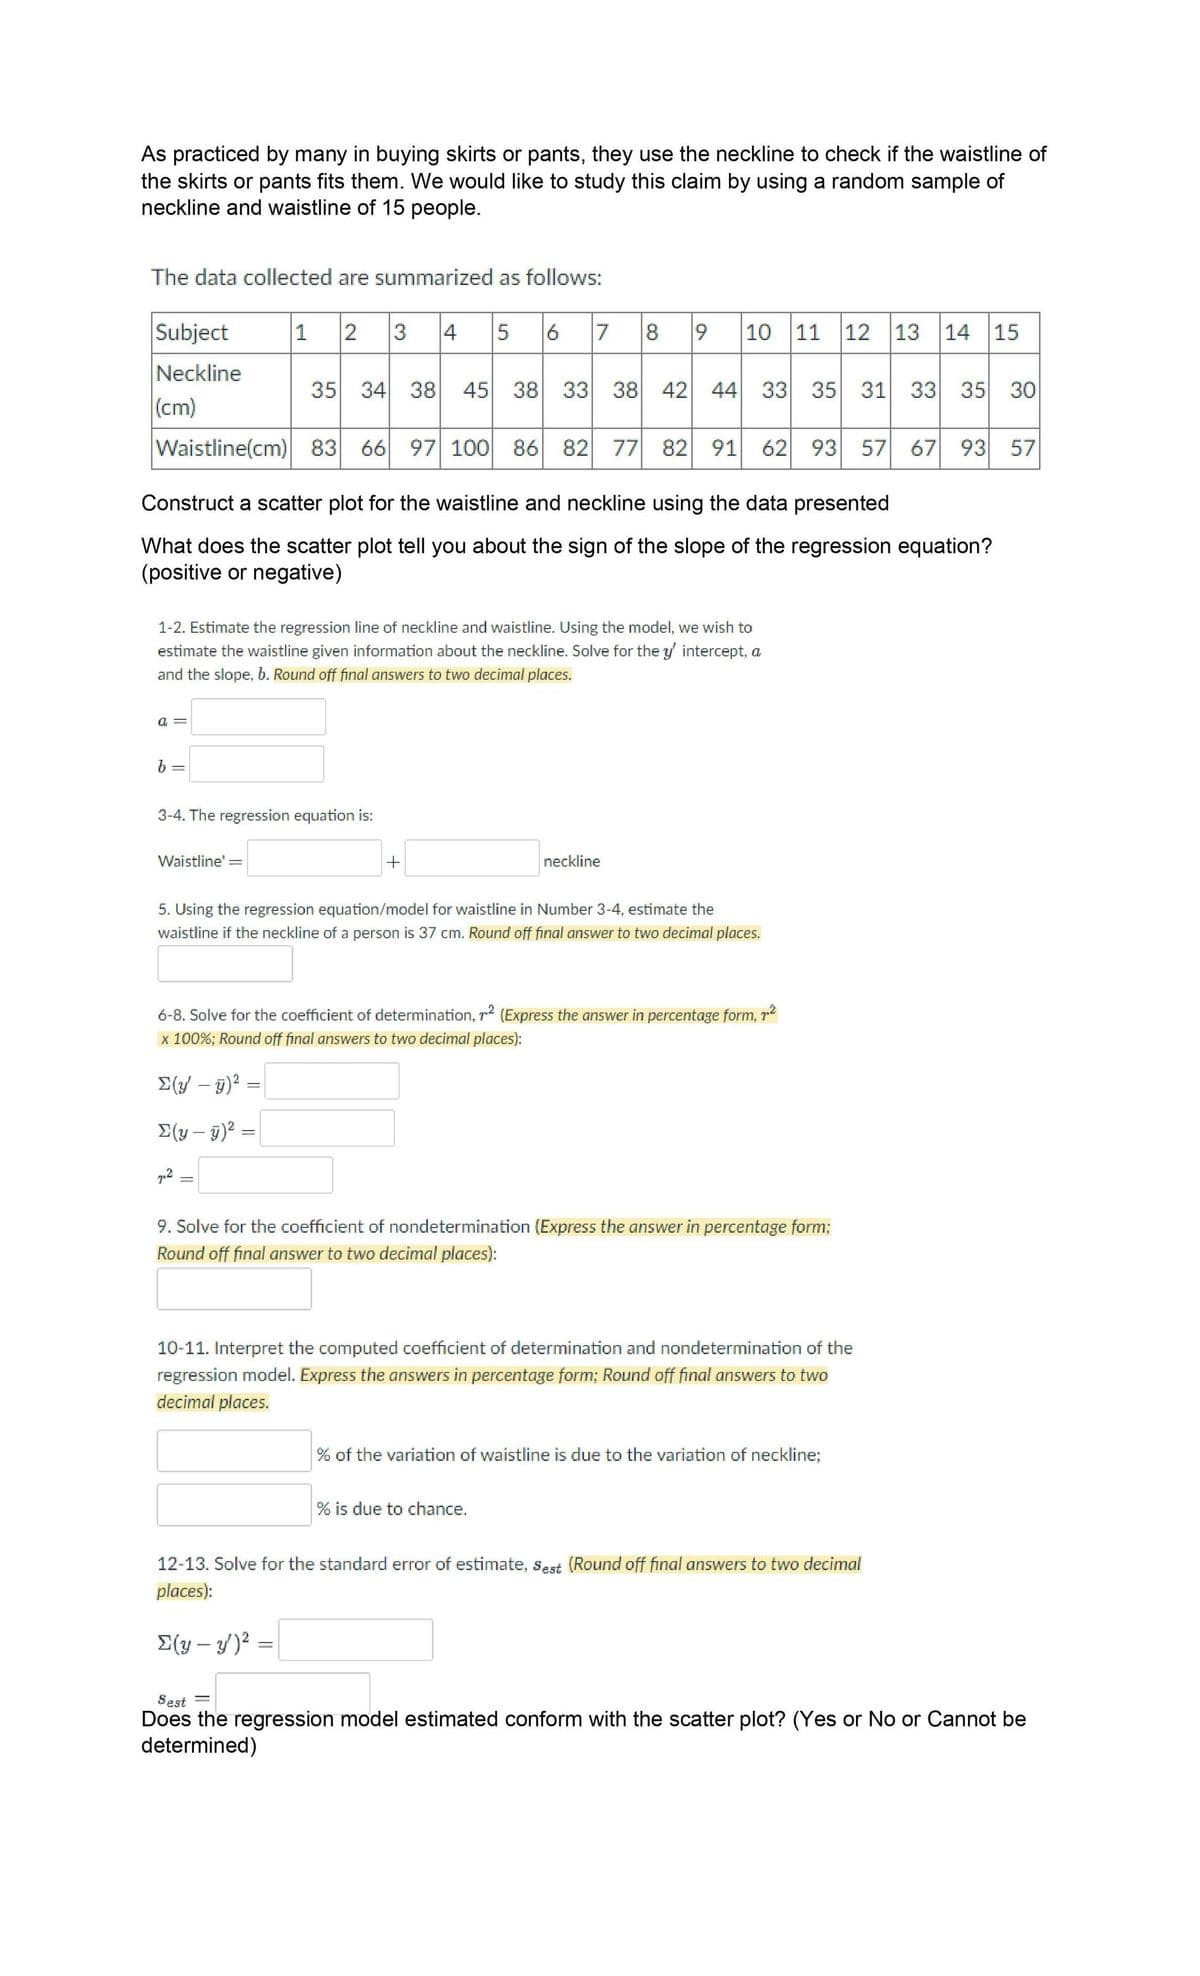
Transcribed Image Text:As practiced by many in buying skirts or pants, they use the neckline to check if the waistline of
the skirts or pants fits them. We would like to study this claim by using a random sample of
neckline and waistline of 15 people.
The data collected are summarized as follows:
Subject
1
2 3
4
5
17
8
169
10
11 12 13
14 15
Neckline
35 34
38
45 38 33 38 42 44
33 35 31
33 35 30
(cm)
Waistline(cm) 83 66
97 100 86 82 77 82 91
62
93 57
67 93 57
Construct a scatter plot for the waistline and neckline using the data presented
What does the scatter plot tell you about the sign of the slope of the regression equation?
(positive or negative)
1-2. Estimate the regression line of neckline and waistline. Using the model, we wish to
estimate the waistline given information about the neckline. Solve for the y intercept, a
and the slope, b. Round off final answers to two decimal places.
a =
b =
3-4. The regression equation is:
Waistline'=
neckline
5. Using the regression equation/model for waistline in Number 3-4, estimate the
waistline if the neckline of a person is 37 cm. Round off final answer to two decimal places.
6-8. Solve for the coefficient of determination, r2 (Express the answer in percentage form, r2
x 100%; Round off final answers to two decimal places):
E(y – 9)² :
E(y – 9)² =
9. Solve for the coefficient of nondetermination (Express the answer in percentage form;
Round off final answer to two decimal places):
10-11. Interpret the computed coefficient of determination and nondetermination of the
regression model. Express the answers in percentage form; Round off final answers to two
decimal places.
% of the variation of waistline is due to the variation of neckline;
% is due to chance.
12-13. Solve for the standard error of estimate, sest (Round off final answers to two decimal
places):
E(y – y)? =
Sest =
Does the regression model estimated conform with the scatter plot? (Yes or No or Cannot be
determined)
Expert Solution
This question has been solved!
Explore an expertly crafted, step-by-step solution for a thorough understanding of key concepts.

Step by step
Solved in 2 steps with 1 images

Recommended textbooks for you
Holt Mcdougal Larson Pre-algebra: Student Edition…
Algebra
ISBN:
9780547587776
Author:
HOLT MCDOUGAL
Publisher:
HOLT MCDOUGAL

College Algebra (MindTap Course List)
Algebra
ISBN:
9781305652231
Author:
R. David Gustafson, Jeff Hughes
Publisher:
Cengage Learning

Glencoe Algebra 1, Student Edition, 9780079039897…
Algebra
ISBN:
9780079039897
Author:
Carter
Publisher:
McGraw Hill
Holt Mcdougal Larson Pre-algebra: Student Edition…
Algebra
ISBN:
9780547587776
Author:
HOLT MCDOUGAL
Publisher:
HOLT MCDOUGAL
College Algebra (MindTap Course List)
Algebra
ISBN:
9781305652231
Author:
R. David Gustafson, Jeff Hughes
Publisher:
Cengage Learning
Glencoe Algebra 1, Student Edition, 9780079039897…
Algebra
ISBN:
9780079039897
Author:
Carter
Publisher:
McGraw Hill