
Glencoe Algebra 1, Student Edition, 9780079039897, 0079039898, 2018
18th Edition
ISBN:9780079039897
Author:Carter
Publisher:Carter
Chapter10: Statistics
Section10.4: Distributions Of Data
Problem 19PFA

Related questions
Question
Transcribed Image Text:10:12 PM Sun Nov 7
26% O
AA
www-awu.aleks.com
Pf iCampus Bb Statistics M...
X ljiwole - Learn
Answered: A...
Bb 5 - Statistic...
ssion Clos...
O DESCRIPTIVE STATISTICS
Cumulative distributions and ogives
Español
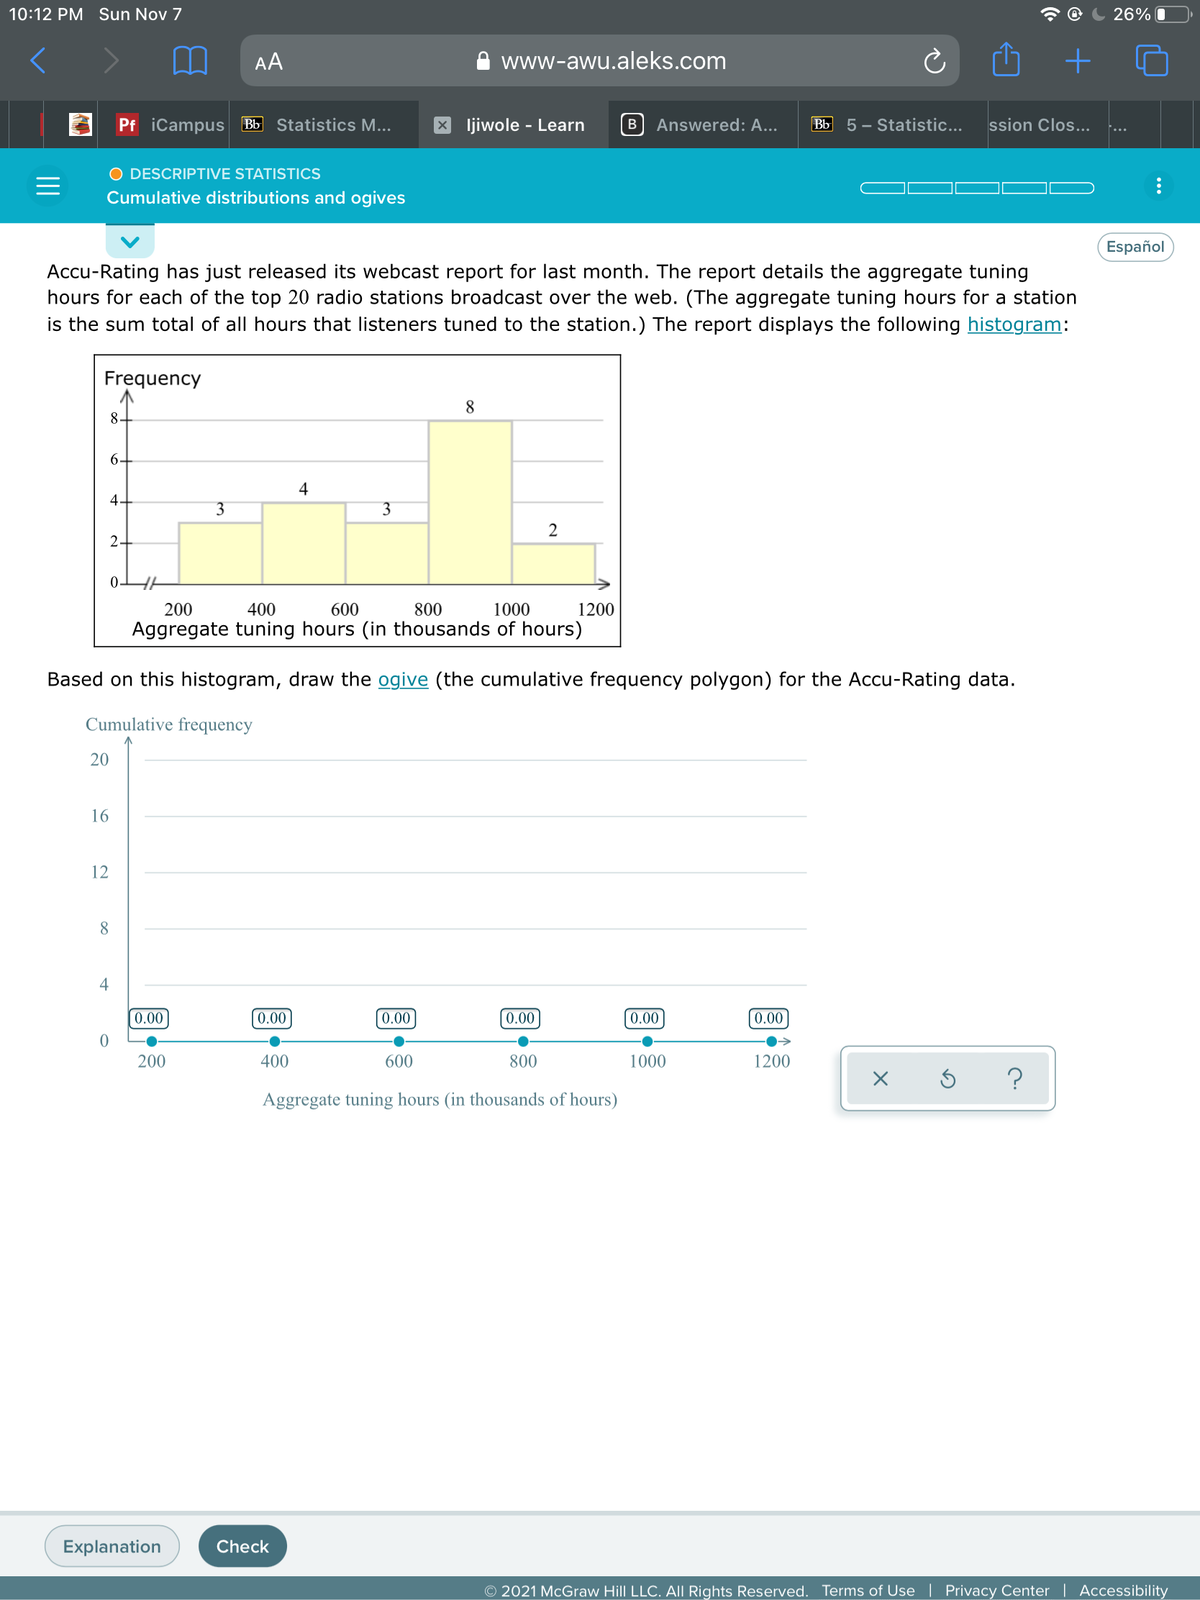
Accu-Rating has just released its webcast report for last month. The report details the aggregate tuning
hours for each of the top 20 radio stations broadcast over the web. (The aggregate tuning hours for a station
is the sum total of all hours that listeners tuned to the station.) The report displays the following histogram:
Frequency
8
8-
4
4-
3
3
2
2-
200
400
600
800
1000
1200
Aggregate tuning hours (in thousands of hours)
Based on this histogram, draw the ogive (the cumulative frequency polygon) for the Accu-Rating data.
Cumulative frequency
20
16
12
8
4
0.00
0.00
0.00
0.00
0.00
0.00
200
400
600
800
1000
1200
?
Aggregate tuning hours (in thousands of hours)
Explanation
Check
O 2021 McGraw Hill LLC. All Rights Reserved. Terms of Use
Privacy Center | Accessibility
Expert Solution
This question has been solved!
Explore an expertly crafted, step-by-step solution for a thorough understanding of key concepts.

This is a popular solution!

Trending now
This is a popular solution!

Step by step
Solved in 2 steps with 3 images

Recommended textbooks for you
Glencoe Algebra 1, Student Edition, 9780079039897…
Algebra
ISBN:
9780079039897
Author:
Carter
Publisher:
McGraw Hill
Glencoe Algebra 1, Student Edition, 9780079039897…
Algebra
ISBN:
9780079039897
Author:
Carter
Publisher:
McGraw Hill