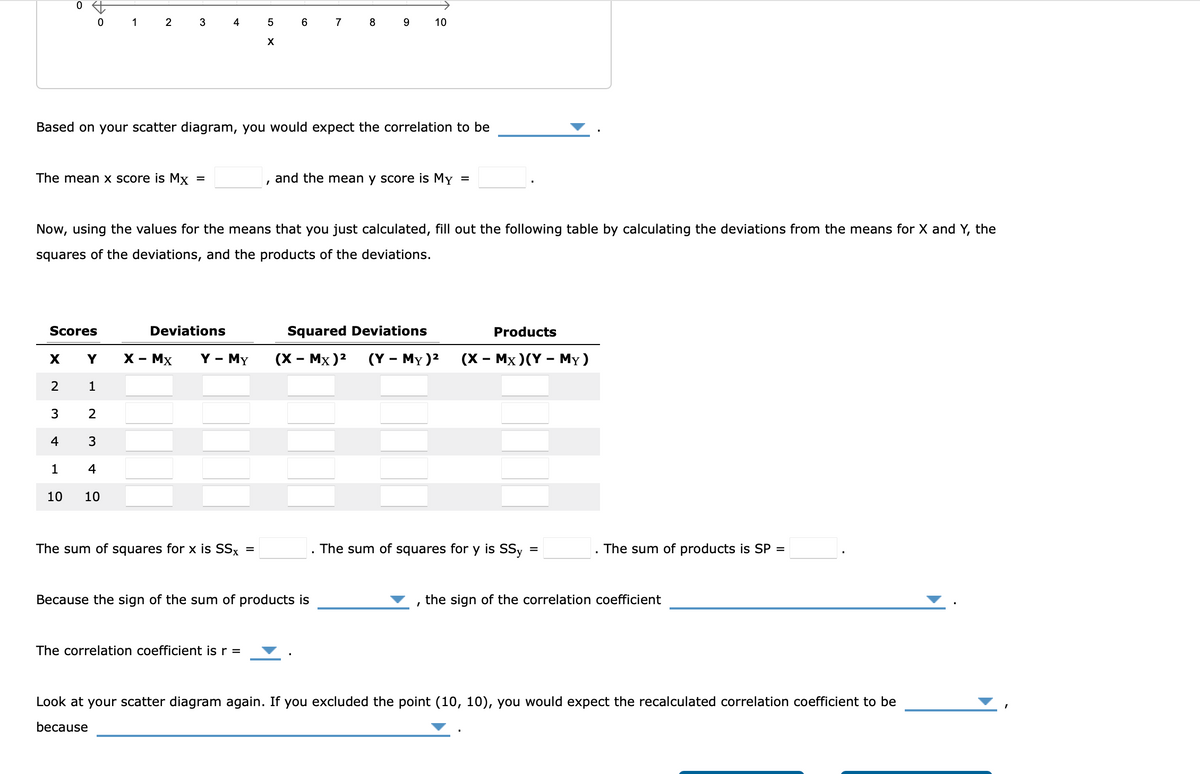
Based on your scatter diagram, you would expect the correlation to be The mean x score is Mx = , and the mean y score is My = Now, using the values for the means that you just calculated, fill out the following table by calculating the deviations from the means for X and Y, the squares of the deviations, and the products of the deviations. Scores Deviations Squared Deviations Products X Y Y - MY (X - MX)² (Y - My)² (X-MX)(Y - My) 2 1 3 2 4 3 1 4 10 10 The sum of squares for x is SSx = The sum of squares for y is SSy = The sum of products is SP = Because the sign of the sum of products is ▼, the sign of the correlation coefficient The correlation coefficient is r = Look at your scatter diagram again. If you excluded the point (10, 10), you would expect the recalculated correlation coefficient to be because X - MX
Based on your scatter diagram, you would expect the correlation to be The mean x score is Mx = , and the mean y score is My = Now, using the values for the means that you just calculated, fill out the following table by calculating the deviations from the means for X and Y, the squares of the deviations, and the products of the deviations. Scores Deviations Squared Deviations Products X Y Y - MY (X - MX)² (Y - My)² (X-MX)(Y - My) 2 1 3 2 4 3 1 4 10 10 The sum of squares for x is SSx = The sum of squares for y is SSy = The sum of products is SP = Because the sign of the sum of products is ▼, the sign of the correlation coefficient The correlation coefficient is r = Look at your scatter diagram again. If you excluded the point (10, 10), you would expect the recalculated correlation coefficient to be because X - MX

MATLAB: An Introduction with Applications
6th Edition
ISBN:9781119256830
Author:Amos Gilat
Publisher:Amos Gilat
Chapter1: Starting With Matlab
Section: Chapter Questions
Problem 1P

Related questions
Question
Transcribed Image Text:O
4
of
0 1 2 3
5
7
8 9 10
X
Based on your scatter diagram, you would expect the correlation to be
The mean x score is Mx =
and the mean y score is My =
1
Now, using the values for the means that you just calculated, fill out the following table by calculating the deviations from the means for X and Y, the
squares of the deviations, and the products of the deviations.
Scores
Deviations
Squared Deviations
Products
X
Y
X - MX Y - MY
(X - MX) ² (Y - My )² (X - MX)(Y - My)
2
1
3
2
3
1
4
10 10
The sum of squares for x is SSx
The sum of squares for y is SSy
=
The sum of products is SP =
Because the sign of the sum of products is
the sign of the correlation coefficient
I
The correlation coefficient is r =
Look at your scatter diagram again. If you excluded the point (10, 10), you would expect the recalculated correlation coefficient to be
because
4
6
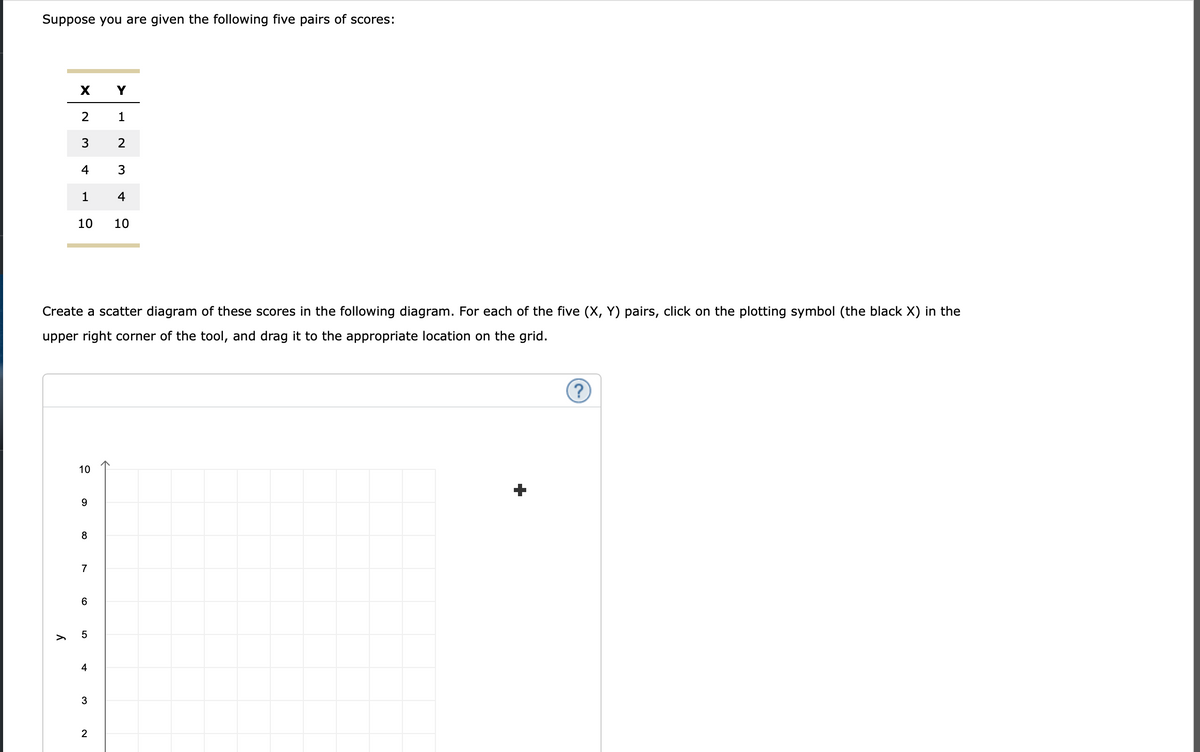
Transcribed Image Text:Suppose you are given the following five pairs of scores:
X
Y
2
1
3
2
4
3
1
4
10
10
Create a scatter diagram of these scores in the following diagram. For each of the five (X, Y) pairs, click on the plotting symbol (the black X) in the
upper right corner of the tool, and drag it to the appropriate location on the grid.
(?)
10
9
8
7
6
5
4
3
2
y
Expert Solution
This question has been solved!
Explore an expertly crafted, step-by-step solution for a thorough understanding of key concepts.

This is a popular solution!

Trending now
This is a popular solution!

Step by step
Solved in 3 steps with 2 images

Recommended textbooks for you
MATLAB: An Introduction with Applications
Statistics
ISBN:
9781119256830
Author:
Amos Gilat
Publisher:
John Wiley & Sons Inc

Probability and Statistics for Engineering and th…
Statistics
ISBN:
9781305251809
Author:
Jay L. Devore
Publisher:
Cengage Learning

Statistics for The Behavioral Sciences (MindTap C…
Statistics
ISBN:
9781305504912
Author:
Frederick J Gravetter, Larry B. Wallnau
Publisher:
Cengage Learning
MATLAB: An Introduction with Applications
Statistics
ISBN:
9781119256830
Author:
Amos Gilat
Publisher:
John Wiley & Sons Inc
Probability and Statistics for Engineering and th…
Statistics
ISBN:
9781305251809
Author:
Jay L. Devore
Publisher:
Cengage Learning
Statistics for The Behavioral Sciences (MindTap C…
Statistics
ISBN:
9781305504912
Author:
Frederick J Gravetter, Larry B. Wallnau
Publisher:
Cengage Learning

Elementary Statistics: Picturing the World (7th E…
Statistics
ISBN:
9780134683416
Author:
Ron Larson, Betsy Farber
Publisher:
PEARSON

The Basic Practice of Statistics
Statistics
ISBN:
9781319042578
Author:
David S. Moore, William I. Notz, Michael A. Fligner
Publisher:
W. H. Freeman

Introduction to the Practice of Statistics
Statistics
ISBN:
9781319013387
Author:
David S. Moore, George P. McCabe, Bruce A. Craig
Publisher:
W. H. Freeman