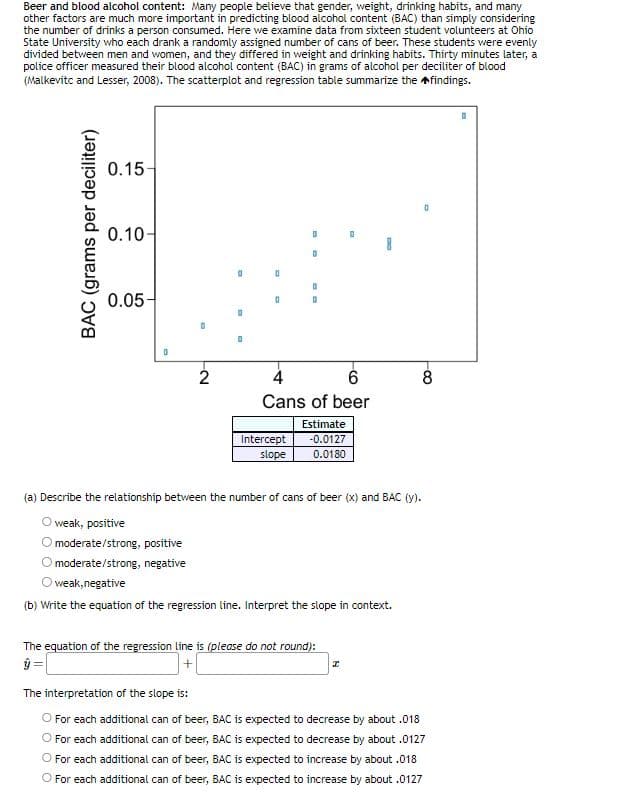
Beer and blood alcohol content: Many people believe that gender, weight, drinking habits, and many other factors are much more important in predicting blood alcohol content (BAC) than simply considering the number of drinks a person consumed. Here we examine data from sixteen student volunteers at Ohio State University who each drank a randomly assigned number of cans of beer. These students were evenly divided between men and women, and they differed in weight and drinking habits. Thirty minutes later, a police officer measured their blood alcohol content (BAC) in grams of alcohol per deciliter of blood (Malkevitc and Lesser, 2008). The scatterplot and regression table summarize the findings. BAC (grams per deciliter) 0.15- 0.10- 0.05- D 2 4 6 Cans of beer Intercept slope Estimate -0.0127 0.0180 (a) Describe the relationship between the number of cans of beer (x) and BAC (y). O weak, positive O moderate/strong, positive moderate/strong, negative O weak, negative (b) Write the equation of the regression line. Interpret the slope in context. The equation of the regression line is (please do not round): ŷ 8 I The interpretation of the slope is: O For each additional can of beer, BAC is expected to decrease by about .018 For each additional can of beer, BAC is expected to decrease by about .0127 For each additional can of beer, BAC is expected to increase by about .018 For each additional can of beer, BAC is expected to increase by about .0127
Beer and blood alcohol content: Many people believe that gender, weight, drinking habits, and many other factors are much more important in predicting blood alcohol content (BAC) than simply considering the number of drinks a person consumed. Here we examine data from sixteen student volunteers at Ohio State University who each drank a randomly assigned number of cans of beer. These students were evenly divided between men and women, and they differed in weight and drinking habits. Thirty minutes later, a police officer measured their blood alcohol content (BAC) in grams of alcohol per deciliter of blood (Malkevitc and Lesser, 2008). The scatterplot and regression table summarize the findings. BAC (grams per deciliter) 0.15- 0.10- 0.05- D 2 4 6 Cans of beer Intercept slope Estimate -0.0127 0.0180 (a) Describe the relationship between the number of cans of beer (x) and BAC (y). O weak, positive O moderate/strong, positive moderate/strong, negative O weak, negative (b) Write the equation of the regression line. Interpret the slope in context. The equation of the regression line is (please do not round): ŷ 8 I The interpretation of the slope is: O For each additional can of beer, BAC is expected to decrease by about .018 For each additional can of beer, BAC is expected to decrease by about .0127 For each additional can of beer, BAC is expected to increase by about .018 For each additional can of beer, BAC is expected to increase by about .0127

Glencoe Algebra 1, Student Edition, 9780079039897, 0079039898, 2018
18th Edition
ISBN:9780079039897
Author:Carter
Publisher:Carter
Chapter10: Statistics
Section10.6: Summarizing Categorical Data
Problem 10CYU

Related questions
Question
Transcribed Image Text:Beer and blood alcohol content: Many people believe that gender, weight, drinking habits, and many
other factors are much more important in predicting blood alcohol content (BAC) than simply considering
the number of drinks a person consumed. Here we examine data from sixteen student volunteers at Ohio
State University who each drank a randomly assigned number of cans of beer. These students were evenly
divided between men and women, and they differed in weight and drinking habits. Thirty minutes later, a
police officer measured their blood alcohol content (BAC) in grams of alcohol per deciliter of blood
(Malkevitc and Lesser, 2008). The scatterplot and regression table summarize the findings.
BAC (grams per deciliter)
0.15-
0.10-
0.05-
0
D
moderate/strong, positive
moderate/strong, negative
2
D
0
0
0
0
D
Intercept
slope
0
D
4
6
Cans of beer
Estimate
-0.0127
0.0180
a
(a) Describe the relationship between the number of cans of beer (x) and BAC (y).
O weak, positive
O weak, negative
(b) Write the equation of the regression line. Interpret the slope in context.
The equation of the regression line is (please do not round):
ŷ=
+
I
8
The interpretation of the slope is:
For each additional can of beer, BAC is expected to decrease by about .018
For each additional can of beer, BAC is expected to decrease by about .0127
For each additional can of beer, BAC is expected to increase by about .018
O For each additional can of beer, BAC is expected to increase by about .0127
Expert Solution
This question has been solved!
Explore an expertly crafted, step-by-step solution for a thorough understanding of key concepts.

This is a popular solution!

Trending now
This is a popular solution!

Step by step
Solved in 3 steps with 7 images

Recommended textbooks for you
Glencoe Algebra 1, Student Edition, 9780079039897…
Algebra
ISBN:
9780079039897
Author:
Carter
Publisher:
McGraw Hill

Functions and Change: A Modeling Approach to Coll…
Algebra
ISBN:
9781337111348
Author:
Bruce Crauder, Benny Evans, Alan Noell
Publisher:
Cengage Learning

College Algebra (MindTap Course List)
Algebra
ISBN:
9781305652231
Author:
R. David Gustafson, Jeff Hughes
Publisher:
Cengage Learning
Glencoe Algebra 1, Student Edition, 9780079039897…
Algebra
ISBN:
9780079039897
Author:
Carter
Publisher:
McGraw Hill
Functions and Change: A Modeling Approach to Coll…
Algebra
ISBN:
9781337111348
Author:
Bruce Crauder, Benny Evans, Alan Noell
Publisher:
Cengage Learning
College Algebra (MindTap Course List)
Algebra
ISBN:
9781305652231
Author:
R. David Gustafson, Jeff Hughes
Publisher:
Cengage Learning