believe that your morning commute to UC Irvine is decreasing every week. You record th e of 7 commutes (one for each day of the week) (in minutes) for the a one-week block and the following one-week block. culations have been done for you: the sample mean difference is -1.714 and the sample standar -iation is 2.984. Conduct a hypothesis test at the a = 0.15 level. The mean differenc
believe that your morning commute to UC Irvine is decreasing every week. You record th e of 7 commutes (one for each day of the week) (in minutes) for the a one-week block and the following one-week block. culations have been done for you: the sample mean difference is -1.714 and the sample standar -iation is 2.984. Conduct a hypothesis test at the a = 0.15 level. The mean differenc

Glencoe Algebra 1, Student Edition, 9780079039897, 0079039898, 2018
18th Edition
ISBN:9780079039897
Author:Carter
Publisher:Carter
Chapter10: Statistics
Section10.4: Distributions Of Data
Problem 19PFA

Related questions
Question
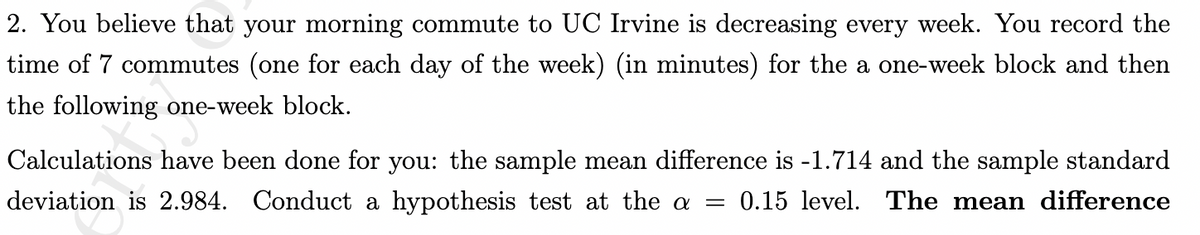
Transcribed Image Text:2. You believe that your morning commute to UC Irvine is decreasing every week. You record the
time of 7 commutes (one for each day of the week) (in minutes) for the a one-week block and then
the following one-week block.
Calculations have been done for you: the sample mean difference is -1.714 and the sample standard
deviation is 2.984. Conduct a hypothesis test at the a = 0.15 level. The mean difference
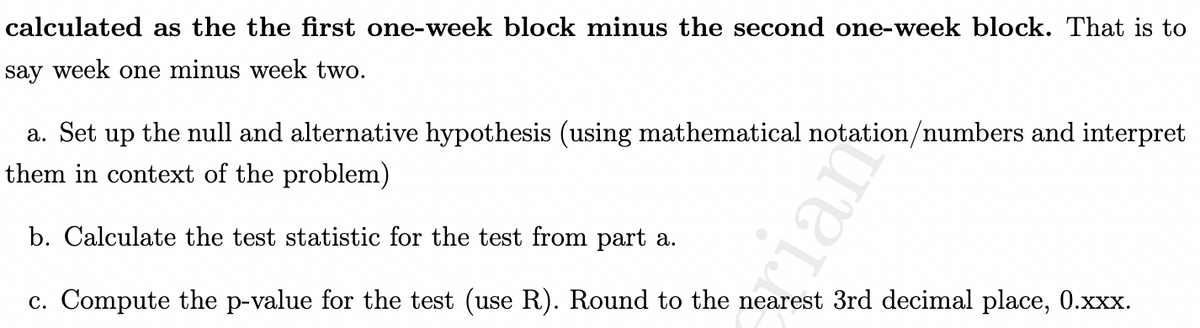
Transcribed Image Text:calculated as the the first one-week block minus the second one-week block. That is to
say week one minus week two.
a. Set up the null and alternative hypothesis (using mathematical notation/numbers and interpret
them in context of the problem)
b. Calculate the test statistic for the test from part a.
c. Compute the p-value for the test (use R). Round to the nearest 3rd decimal place, 0.xxx.
cian
Expert Solution
This question has been solved!
Explore an expertly crafted, step-by-step solution for a thorough understanding of key concepts.

This is a popular solution!

Trending now
This is a popular solution!

Step by step
Solved in 3 steps with 1 images

Recommended textbooks for you
Glencoe Algebra 1, Student Edition, 9780079039897…
Algebra
ISBN:
9780079039897
Author:
Carter
Publisher:
McGraw Hill
Glencoe Algebra 1, Student Edition, 9780079039897…
Algebra
ISBN:
9780079039897
Author:
Carter
Publisher:
McGraw Hill