Below are data from a study following different grassland habitats that experience fire at different frequencies. In each graph, the x axis is the number of plant species found in the habitat and the y axis is the percent of grassland habitats sampled. The habitats are split into those experiencing fire approximately every year (left), every 5 years (middle), and every 10 years (right). Fire Every "1 year Fire Every "5 years Fire Every 10 years Number of Plant Species Number of Plant Species Number of Plant Species Do these data support the Intermediate Disturbance Hypothesis? We cannot determine from these data if the hypothesis is supported Yes No Percent of Habitats Percent of Habitats Percent of Habitats
Below are data from a study following different grassland habitats that experience fire at different frequencies. In each graph, the x axis is the number of plant species found in the habitat and the y axis is the percent of grassland habitats sampled. The habitats are split into those experiencing fire approximately every year (left), every 5 years (middle), and every 10 years (right). Fire Every "1 year Fire Every "5 years Fire Every 10 years Number of Plant Species Number of Plant Species Number of Plant Species Do these data support the Intermediate Disturbance Hypothesis? We cannot determine from these data if the hypothesis is supported Yes No Percent of Habitats Percent of Habitats Percent of Habitats

Biology (MindTap Course List)
11th Edition
ISBN:9781337392938
Author:Eldra Solomon, Charles Martin, Diana W. Martin, Linda R. Berg
Publisher:Eldra Solomon, Charles Martin, Diana W. Martin, Linda R. Berg
Chapter55: Ecosystems And The Biosphere
Section: Chapter Questions
Problem 18TYU: INTERTRET DATA Scientists have compiled databases of large forest wildfires in the western United...

Related questions

Question
bio question help
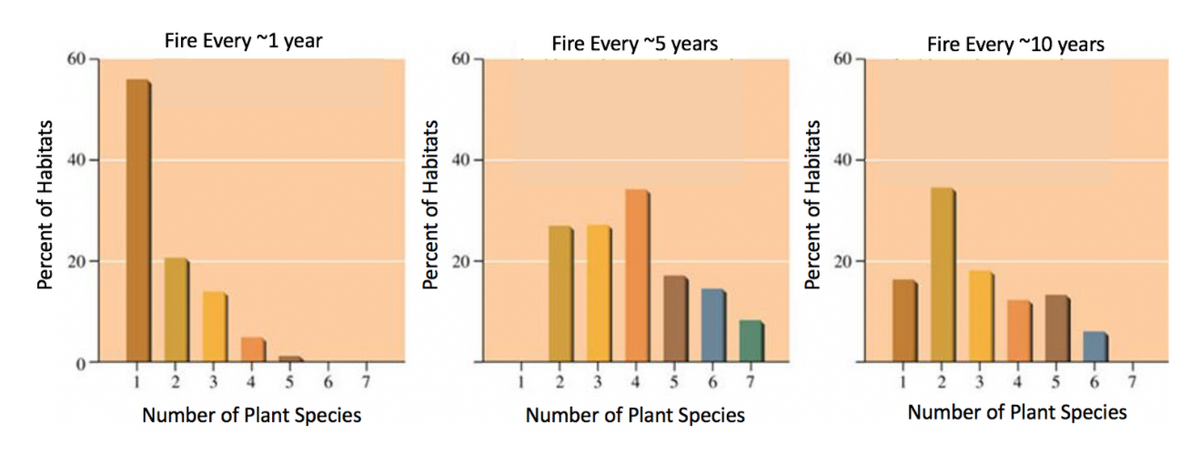
Transcribed Image Text:Fire Every ~1 year
Fire Every ~5 years
Fire Every ~10 years
60
20-
1 2 3
4
5
6
1 2
3 4 5 6 7
1 2 3 4 5 6 7
Number of Plant Species
Number of Plant Species
Number of Plant Species
Percent of Habitats
Percent of Habitats
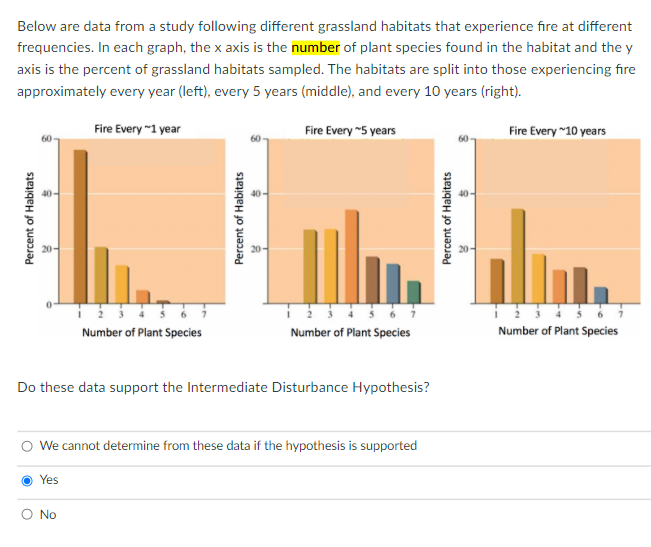
Transcribed Image Text:Below are data from a study following different grassland habitats that experience fire at different
frequencies. In each graph, the x axis is the number of plant species found in the habitat and the y
axis is the percent of grassland habitats sampled. The habitats are split into those experiencing fire
approximately every year (left), every 5 years (middle), and every 10 years (right).
Fire Every "1 year
Fire Every "5 years
Fire Every "10 years
Number of Plant Species
Number of Plant Species
Number of Plant Species
Do these data support the Intermediate Disturbance Hypothesis?
We cannot determine from these data if the hypothesis is supported
O Yes
O No
Percent of Habitats
Percent of Habitats
Percent of Habitats
Expert Solution
This question has been solved!
Explore an expertly crafted, step-by-step solution for a thorough understanding of key concepts.

This is a popular solution!

Trending now
This is a popular solution!

Step by step
Solved in 2 steps

Knowledge Booster


Learn more about
Need a deep-dive on the concept behind this application? Look no further. Learn more about this topic, biology and related others by exploring similar questions and additional content below.Recommended textbooks for you
Biology (MindTap Course List)
Biology
ISBN:
9781337392938
Author:
Eldra Solomon, Charles Martin, Diana W. Martin, Linda R. Berg
Publisher:
Cengage Learning

Case Studies In Health Information Management
Biology
ISBN:
9781337676908
Author:
SCHNERING
Publisher:
Cengage

Concepts of Biology
Biology
ISBN:
9781938168116
Author:
Samantha Fowler, Rebecca Roush, James Wise
Publisher:
OpenStax College
Biology (MindTap Course List)
Biology
ISBN:
9781337392938
Author:
Eldra Solomon, Charles Martin, Diana W. Martin, Linda R. Berg
Publisher:
Cengage Learning
Case Studies In Health Information Management
Biology
ISBN:
9781337676908
Author:
SCHNERING
Publisher:
Cengage
Concepts of Biology
Biology
ISBN:
9781938168116
Author:
Samantha Fowler, Rebecca Roush, James Wise
Publisher:
OpenStax College