Below are two boxplots. Data 1 Data 2 21 7. Based on what the boxplots show you, write True or False next to each of the following statements. 1. In Data 1, there is more data between 4 and 7 than between 2 and 4. 2. Data 2 is skewed to the left. 3. There is more variation in Data 1 than in Data 2. 4. Data 1's first quartile is equivalent to Data 2's second quartile.
Below are two boxplots. Data 1 Data 2 21 7. Based on what the boxplots show you, write True or False next to each of the following statements. 1. In Data 1, there is more data between 4 and 7 than between 2 and 4. 2. Data 2 is skewed to the left. 3. There is more variation in Data 1 than in Data 2. 4. Data 1's first quartile is equivalent to Data 2's second quartile.

Glencoe Algebra 1, Student Edition, 9780079039897, 0079039898, 2018
18th Edition
ISBN:9780079039897
Author:Carter
Publisher:Carter
Chapter10: Statistics
Section10.2: Representing Data
Problem 24PFA

Related questions
Question
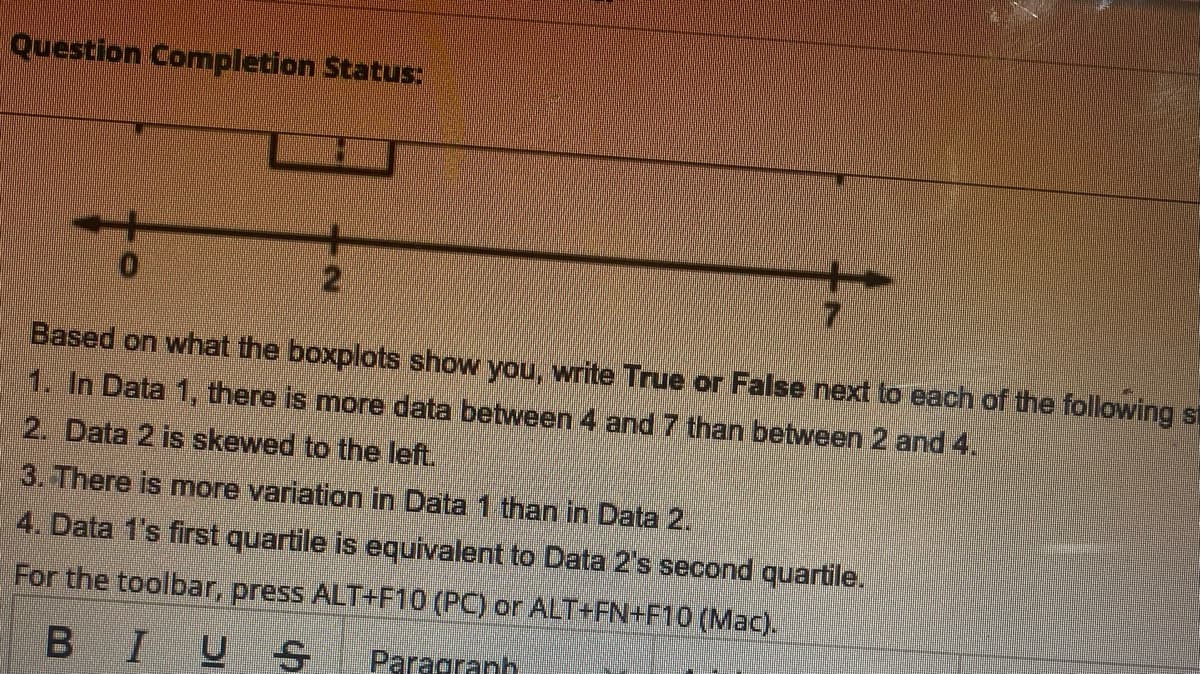
Transcribed Image Text:Question Completion Status:
Based on what the boxplots show you, write True or False next to each of the following st
1. In Data 1, there is more data between 4 and 7 than between 2 and 4.
2. Data 2 is skewed to the left.
3. There is more variation in Data 1 than in Data 2.
4. Data 1's first quartile is equivalent to Data 2's second quartile.
For the toolbar, press ALT+F10 (PC) or ALT+FN+F10 (Mac).
BIUS
Paragranh
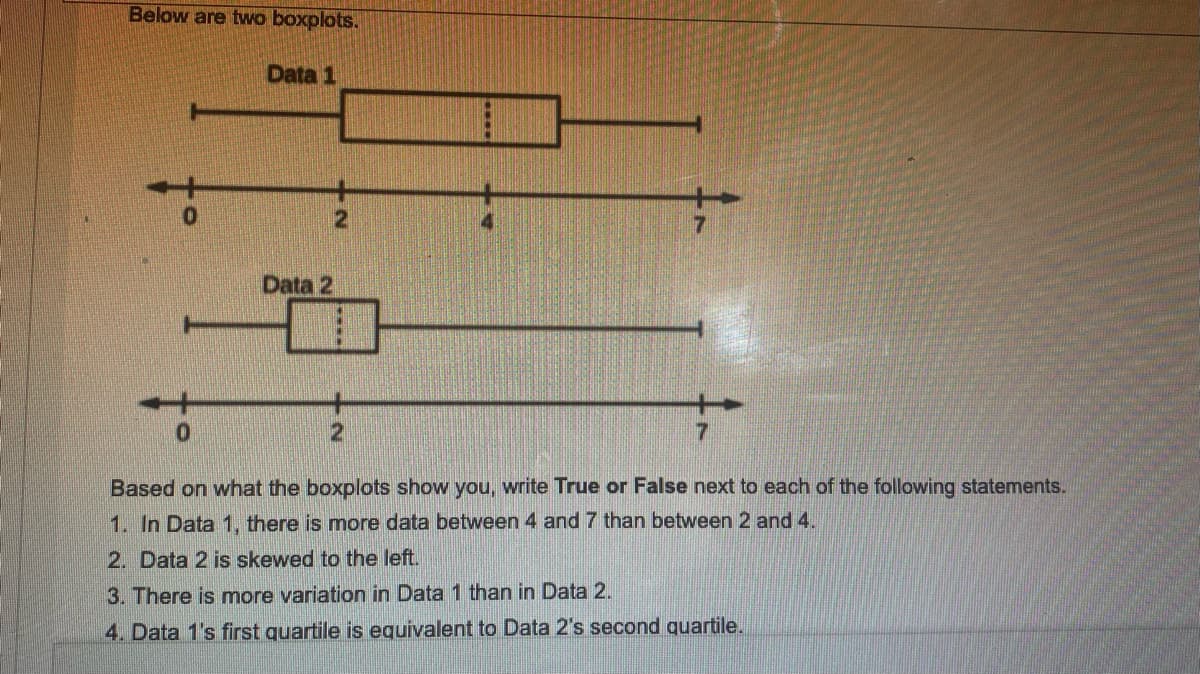
Transcribed Image Text:Below are two boxplots.
Data 1
Data 2
Based on what the boxplots show you, write True or False next to each of the following statements.
1. In Data 1, there is more data between 4 and 7 than between 2 and 4.
2. Data 2 is skewed to the left.
3. There is more variation in Data 1 than in Data 2.
4. Data 1's first quartile is equivalent to Data 2's second quartile.
Expert Solution
Step 1
Based on box plots write whether the statements true or false

Step by step
Solved in 2 steps with 1 images

Recommended textbooks for you
Glencoe Algebra 1, Student Edition, 9780079039897…
Algebra
ISBN:
9780079039897
Author:
Carter
Publisher:
McGraw Hill
Glencoe Algebra 1, Student Edition, 9780079039897…
Algebra
ISBN:
9780079039897
Author:
Carter
Publisher:
McGraw Hill