make a short description about the shape of distribution

Chapter9: Sequences, Probability And Counting Theory
Section9.7: Probability
Problem 2SE: What is a sample space?

Related questions
Question
make a short description about the shape of distribution
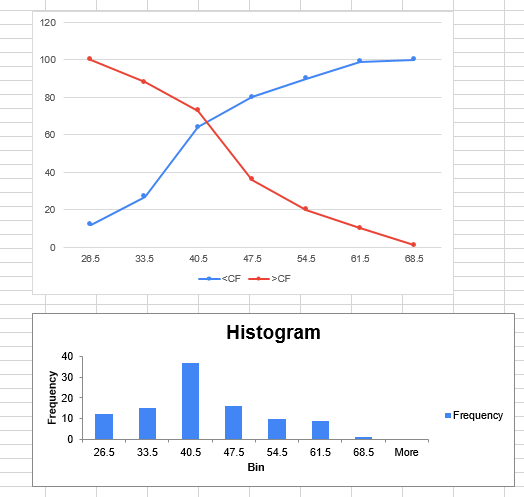
Transcribed Image Text:120
100
80
60
40
20
28.5
33.5
40.5
47.5
54.5
61.5
68.5
<CF >CF
Histogram
40
30
20
10
Frequency
26.5
33.5
40.5
47.5
54.5
61.5
68.5
More
Bin
Expert Solution
This question has been solved!
Explore an expertly crafted, step-by-step solution for a thorough understanding of key concepts.

Step by step
Solved in 2 steps

Recommended textbooks for you

College Algebra (MindTap Course List)
Algebra
ISBN:
9781305652231
Author:
R. David Gustafson, Jeff Hughes
Publisher:
Cengage Learning
College Algebra (MindTap Course List)
Algebra
ISBN:
9781305652231
Author:
R. David Gustafson, Jeff Hughes
Publisher:
Cengage Learning