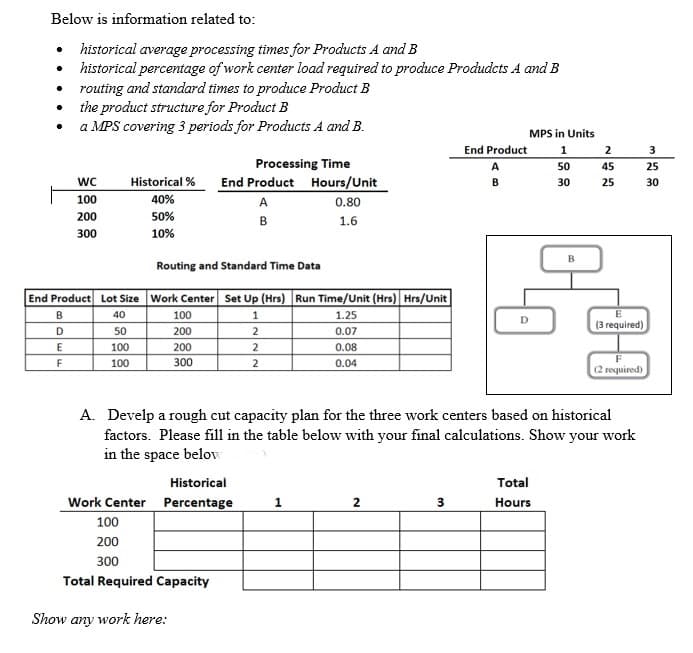
Below is information related to: historical average processing times for Products A and B historical percentage of work center load required to produce Produdcts A and B routing and standard times to produce Product B • the product structure for Product B • a MPS covering 3 periods for Products A and B. MPS in Units End Product 2 Processing Time A 50 45 25 Historical % End Product Hours/Unit wC B. 30 25 30 100 40% A 0.80 200 50% в 1.6 300 10% Routing and Standard Time Data End Product Lot Size Work Center Set Up (Hrs) Run Time/Unit (Hrs) Hrs/Unit B 40 100 1 1.25 D (3 required) D 50 200 0.07 100 200 0.08 F 100 300 0.04 (2 required) A. Develp a rough cut capacity plan for the three work centers based on historical factors. Please fill in the table below with your final calculations. Show your work in the space belov Historical Total Work Center Percentage 1 2 3 Hours 100 200 300 Total Required Capacity Show any work here:


Critical Path Method
The critical path is the longest succession of tasks that has to be successfully completed to conclude a project entirely. The tasks involved in the sequence are called critical activities, as any task getting delayed will result in the whole project getting delayed. To determine the time duration of a project, the critical path has to be identified. The critical path method or CPM is used by project managers to evaluate the least amount of time required to finish each task with the least amount of delay.
Cost Analysis
The entire idea of cost of production or definition of production cost is applied corresponding or we can say that it is related to investment or money cost. Money cost or investment refers to any money expenditure which the firm or supplier or producer undertakes in purchasing or hiring factor of production or factor services.
Inventory Management
Inventory management is the process or system of handling all the goods that an organization owns. In simpler terms, inventory management deals with how a company orders, stores, and uses its goods.
Project Management
Project Management is all about management and optimum utilization of the resources in the best possible manner to develop the software as per the requirement of the client. Here the Project refers to the development of software to meet the end objective of the client by providing the required product or service within a specified Period of time and ensuring high quality. This can be done by managing all the available resources. In short, it can be defined as an application of knowledge, skills, tools, and techniques to meet the objective of the Project. It is the duty of a Project Manager to achieve the objective of the Project as per the specifications given by the client.
Question is attached


Trending now
This is a popular solution!

Step by step
Solved in 3 steps with 3 images


