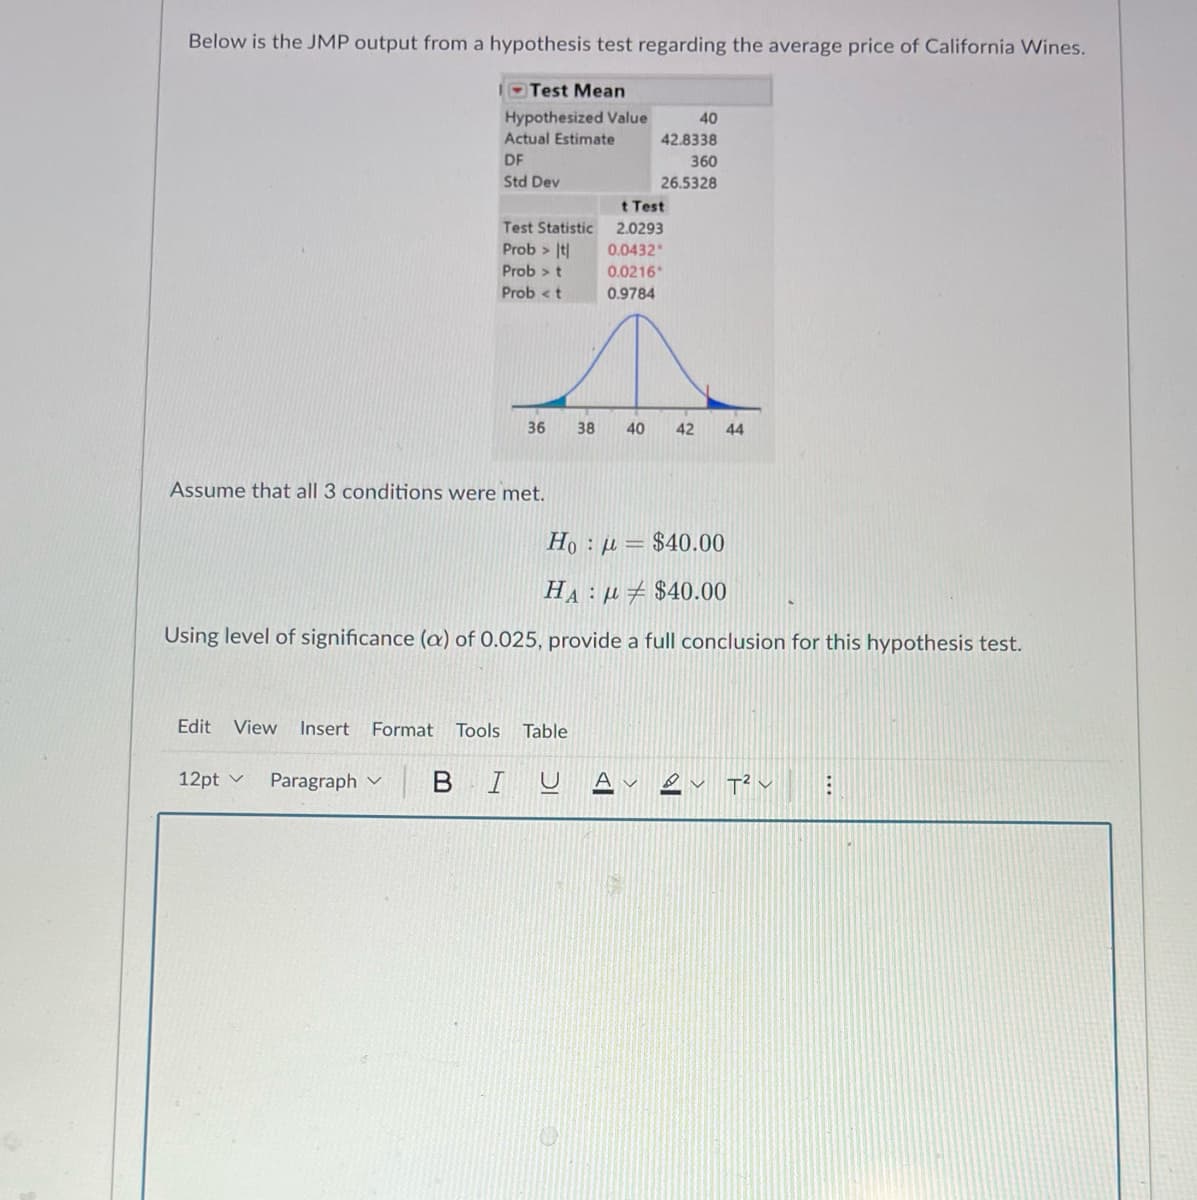
Below is the JMP output from a hypothesis test regarding the average price of California Wines. Test Mean Hypothesized Value 40 Actual Estimate 42.8338 DF 360 Std Dev 26.5328 t Test Test Statistic 2.0293 Prob > It| 0.0432 Prob > t 0.0216* Prob


Q: A manufacturer produces piston rings for an automobile engine. It is known that ring diameter is…
A:
Q: Assume that Y denotes the number of bacteria per cubic centimeter in a particular liquid and that Y…
A:
Q: A fast-food restaurant manager believes that 27% of customers who order Double Whopper Cheeseburgers…
A: The random variable X follows normal distribution. We have to find the test statistic. This is…
Q: 1st statement: The number and choice of graphs and tables under results have significant bearing…
A: Internal validity is the strength used to determine the true cause-and -effect relationship between…
Q: In the correlation coefficient r = 0.78, what percentage of variation in y is explained by the…
A:
Q: We look at a random sample of 1000 United flights in the month of December comparing the actual…
A:
Q: 3. Find A.M. from the following frequency distribution. Wages No. of workers 100 120 140 160 180 200…
A:
Q: (a) Construct a 99% confidence interval for the population proportion. (b) Interpret the results.
A: Given : Sample Size, n = 3250 Number of successes, x = 1448
Q: Show your solutions and draw the curves for the word problems. I. Find the area under the normal…
A: According to our policy we can answer only first question, for remaining please repost the question.…
Q: 3x2 where -c < x < c. 16 11. Let the probability density function of X be defined by f(x) = i.…
A:
Q: A judge chosen at random reaches a just decision roughly 80% of the time. What is the probability…
A:
Q: Consider the following null and alternative hypotheses: Ho:u = 60 versus H1: µ > 60 Suppose you…
A:
Q: 3.3 Solve the below problem: Assume that Y denotes the number of bacteria per cubic centimeter in a…
A:
Q: 5. Suppose passengers arrive at a bus stop according to PP(A). Buses leaves the stop at times, T,…
A: SOLUTION: We know that, the arrival of buss is a poison process (λ) Thus the waiting time will…
Q: A clothing store wants to investigate customer preferences between four different types of clothes…
A: a) In this case, it is appropriate to perform one way ANOVA model. Assumptions of a one-way ANOVA…
Q: a. Is there a main effect of Drug Dose? Explain. b. Is there a main effect of Sex? Explain. c.…
A: a. Yes, because the mean food consumption of food is higher for the "NoDrug" group compared to the…
Q: Random samples of size 4 are drawn, with replacement, from the finite population 2, 4, and 6. FindH_…
A:
Q: It did not answer the questions since it was asking What is the probability that Bill was accepted…
A:
Q: 4. Calculate Rank Co-efficient of correlation for the data given below: S. No. A B C D E F GH I J K…
A:
Q: A tea store manager claims that Branch A has lower average daily sales compared to Branch B. He…
A: According to our policy we can answer only first three question for remaining please repost the…
Q: Below are sample research questions. Identify which T-test (Independent or Dependent) are you going…
A: The objective, in this case, is to identify the appropriate test, which is to be followed the…
Q: An empirical researcher reports the following for a particular stock: “In our data sample we find…
A:
Q: Do people feel hungrier after sampling a healthy snack? Researchers randomly assign volunteers into…
A: For the given data Perform one-way ANOVA hypothesis test.
Q: Suppose that X1 and X2 are Bernoulli random variables with parameter 0. (a) Find two different joint…
A:
Q: Example 26. In how many ways can 7 gentlemen and 7 ladies be seated at a round table so that no 2…
A:
Q: 1.4 In your own words, discuss the concepts of a correlation coefficients and covariances. 1.5 If Y,…
A: Solution
Q: An analyst calculated the correlation coefficient between the unemployment rate in the United States…
A: Strength of Correlation coefficient is If r<0.5 weak correlation If r>0.5 strong correlation…
Q: Question 1 What is the variable type for the type of flooring in a room? O Qualitative Discrete O…
A: Quantitative variable are numeric on nature and divided into two categories discrete and continuous.
Q: Write the null and alternative hypothesis for the following research problems (2 points each). A…
A:
Q: 2. The box and whisker diagram below indicates that the distribution of the data is: 13 20 31 42 a)…
A: The question is about to find dist. of data Given : From boxplot : Min = 5 Q1 = 13 Median = 20 Q3 =…
Q: The mean annual income of workers who are college graduates greater than 120,000.00 a year
A: Given problem Given that The mean annual income of workers who are college graduates greater…
Q: Two suppliers manufacture a plastic gear used in a laser printer. The impact strength of these gears…
A: From the provided information,
Q: A problem with a phone line that prevents a customer from receiving or making calls is upsetting to…
A: Note : As per guidelines we are supposed to solve only one question at a time .Please repost the…
Q: For the following two samples of scores, calculate the pooled variance from an Independent-Samples…
A:
Q: In a random sample of 1000 voters nationwide, 357 are found to support a particular candidate for…
A:
Q: The lives of Globewrite light bulbs made by Glowbuff Inc. have a mean of 1000 hours and standard…
A:
Q: 6. What are graph and diagrams? What are the importance and limitation of diagrammatic ar graphical…
A: Graphs are used to represent statistical data. It visulaizes how two or more variables that are…
Q: Long-distance runners have contended that moderate exposure to ozone increases lung capacity. To…
A: Claim : the ozone exposure increases lung capacity.
Q: A.Find the class mark range with 7 classes as the classes. Arrange the classes in decreasing order.…
A:
Q: 3.3 Solve the below problem: Assume that Y denotes the number of bacteria per cubic centimeter in a…
A:
Q: Exhibit 10-2 The following information was obtained from matched samples. The daily production rates…
A: Since you have asked multiple question, we will solve the first question for you. If you want any…
Q: 1. A Pearson's Product Moment Correlation coefficient with a value of zero means that relationship…
A:
Q: Spurious Correlations What is a spurious correlation? What makes them dangerous? What makes them…
A: Spurious Correlation: In statistics, when two variables are found to be correlated but actually are…
Q: An ecological study was carried out to assess the rates of vegetation growth at four marshy…
A: For the given data, we need to test ANOVA t-test at 0.05 significance level.
Q: N(9,64) , CALCULATE 95% confidence interval. Explain your steps
A: Solution-: Given: i.e. and We want to find 95% C.I.
Q: 9. a. Obtain the linear trend equation for the following data on new checking accounts at Fair…
A:
Q: CUNY QC Graduate student surveyed 600 parents/guardians of 2nd-grade school students in the…
A: Given : Total number of participants = 600 The number of participants who strongly agreed = 165 The…
Q: Random samples of size 4 are drawn, with replacement, from the finite population 2, 4, and 6. FindH_…
A:
Q: The following is a discrete probability distribution. Outcome, x Probability, P(x) 2- P(z) 3 0.1 8…
A:
Q: Directions: Illustrate the rejection region given the critical value and identify if the t-values…
A: From the given values


Trending now
This is a popular solution!

Step by step
Solved in 2 steps

- Groups of non-smokers who were not exposed to smoke and non-smokers who were exposed to secondhand smoke were sampled to test their cotinine levels (ng/mL). Using a 0.05 significance level, test the claim that non-smokers exposed to tobacco smoke have higher mean cotinine levels than non-smokers that are not exposed. Exposed to secondhand smoke: n=40, x̅=60.58, s=138.08 Not exposed to secondhand smoke: n=40, x̅=16.35, s=62.53 1. H^0=? 2. H^1=? 3. Critical value(s):? 4. Graph rejection regions with labelled critical value(s) 5. Test statistic: State what test stat is being used (z,t,etc.) the formula being used, and what values are substituted into the formula. 6. P-value=? 7. State the conclusion of the test in the context of the problem (for example, not just "reject null" but what does it mean for this specific problem):Suppose the National Transportation Safety Board (NTSB) wants to examine the safety of compact cars, midsize cars, and full-size cars. It collects a sample of three for each of the treatments (cars types). Using the hypothetical data provided below, run your analyses in R to test whether the mean pressure applied to the driver’s head during a crash test is equal for each types of car (higher pressure = less safe). Compact Car Midsize Car Full-Size Car 643 469 484 655 427 456 702 525 402 What kind of statistical analysis do you need to use and why? State the null and alternative hypotheses. Check your assumptions. Include screenshots of your R output and explain why each of them are or are not met. Using R, run your analysis and include a screenshot. Using R, run post-hoc tests and include a screenshot. What do you conclude about the null hypothesis? What does each of your p-values tell you? Are there differences and in which comparisons?…A quality control expert at a local dairy claims that its cartoons contain more than 64oz of milk a sample of 15 cartoons reveals a mean of 65 and 1.1 oxs respectively. At the 1% level, does the appropriate hypothesis support his claim? find and interpret the p value
- The following summary table presents the results from a repeated-measures ANOVA comparing four treatment conditions, each with a sample of n = 10 subjects. Fill in the missing values in the table. (Hint: State with the df values.) Source SS df MS Between treatments 20 F = 5.00 Within treatments 158 Between subjects Error 108 TotalThe weights (lb) of discarded plastic from a sample of households is listed and the summary statistics are n=62, x̅=1.911 lb, and s=1.065 lb. Use a 0.05 significance level to test the claim that the mean weight of discarded plastics from a population of households is greater than 1.800 lb. What null hypothesis can be formulated for this claim?A researcher wishes to determine whether the blood pressure of vegetarians is, on average, lower than the blood pressure of nonvegetarians. Independent simple random samples of 85 vegetarians and 75 nonvegetarians yielded the following sample statistics for systolic blood pressure. Test the claim that vegetarians have lower blood pressure than non-vegetarians. Use a 0.05 level of significance. Vegetarians Non Vegetarians n=85 n=75 Mean=124.1mmHg Mean=138.7mmHg St dev=38.7mmHg St dev=39.2mmHg Null and alternative hypothesis (give both in symbolic form and sentence form): Test statistic and p-value (show the calculation or show what you entered into the calculator ): Technical conclusion, circle one: reject the null hypothesis or fail to reject the null hypothesis Why did you choose to reject or fail to reject the null hypothesis? Nontechnical conclusion addressing the original claim:
- The US Department of Housing and Urban Development provides data to show the fair market monthly rent for metropolitan areas. The data in cells E1 to J4 show the fair market monthly rent ($) in 2005 for one-bedroom, two-bedroom, and three-bedroom apartments for five metropolitan areas. At the .05 level of significance test whether the mean fair market rent is the same for each metropolitan area and state your conclusion. Place your output in cell A5. At the .05 level of significance test whether the mean fair market rent is the same for each number of bedrooms and state your conclusion. Boston Miami San Diego San Jose Washington One Bedroom 1077 775 975 1107 1045 Two Bedrooms 1266 929 1183 1313 1187 Three Bedrooms 1513 1204 1725 1889 1537The National Transportation Safety Board wants to look at the safety of three different sizes of cars. Using the data below, determine the whether the mean pressure applied to the driver`s head during a crash is equal for each type of car at alpha = 0.01 Compact cars Midsize cars Full-size Cars 643 469 484 655 427 456 702 525 402 a) Ho: Ha : b) Decision c) ConclusionA cereal company claims that the mean weight of the cereal in its packets is not 12 oz. Identify the null hypothesis Ho.
- In a study to determine whether counseling could help people lose weight, a sample of people experienced a group-based behavioral intervention, which involved weekly meetings with a trained interventionist for a period of six months. The following data are the numbers of pounds lost for 14 people. Assume the population is approximately normal. Perform a hypothesis test to determine whether the mean weight loss is greater than 15 pounds. Use the α = 0.01 level of significance and the P-value method with the TI-84 Plus calculator. 22.9 28.8 8.1 24.4 21.7 13.4 17.6 21.5 37.8 34.1 12.6 36.8 24.6 19.9 Compute the P-value. Round the answer to at least four decimal places. P-value = ___ How do I solve this problem using TI-84 calculator?The quality-control manager at a compact fluorescent light bulb (CFL) factory needs to determine whether the mean life of a large shipment of CFLs is equal to 7,472 hours. The population standard deviation is 1,080 hours. A random sample of 81 light bulbs indicates a sample mean life of 7,172 hours. a. At the 0.05 level of significance, is there evidence that the mean life is different from 7,472 hours? b. Compute the p-value and interpret its meaning. c. Construct a 95% confidence interval estimate of the population mean life of the light bulbs. d. Compare the results of (a) and (c). What conclusions do you reach? a. Let μ be the population mean. Determine the null hypothesis, H0, and the alternative hypothesis, H1. H0: μ= H1: μ≠ What is the test statistic? ZSTAT= (Round to two decimal places as needed.) What is/are the critical value(s)? (Round to two decimal places as needed. Use a comma to separate answers as needed.) What is the final…A survey on lamb farms was conducted and data were collected on the followingvariables from a random sample of 30 farmers. Y = average live weight of ewes (kg)X1 = area of grazing land (m2) X2 = proportion of farm area that cannot be cultivatedX3 = proportion of area closed for lambs before weaning