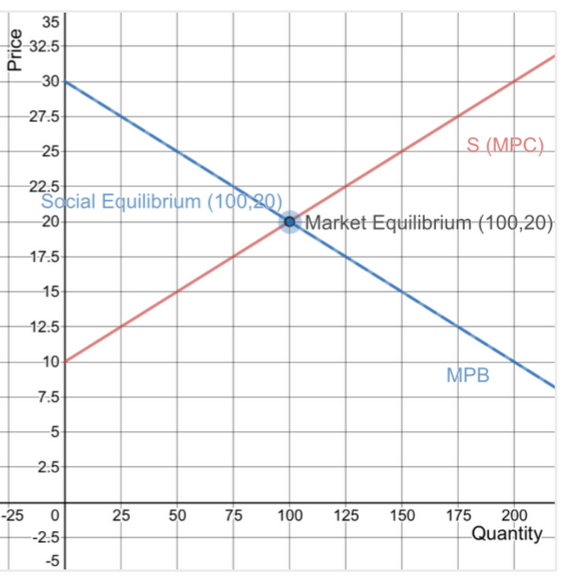
Below is the the market demand curve for reusable water bottles when only the marginal private benefits (MPB) that the owners of reusable water bottles receive are taken into account. Let's say that the government issued vouchers that ensured the reusable water bottle buyers received $10 per bottle. Assume that this will shift the demand curve to the marginal social benefit level (MSB). Move the demand curve to show this change and reposition the Social Equilibrium point to reflect the socially optimal price and quantity. Provide your answer below: 35 32.5 rice
Below is the the market demand curve for reusable water bottles when only the marginal private benefits (MPB) that the owners of reusable water bottles receive are taken into account. Let's say that the government issued vouchers that ensured the reusable water bottle buyers received $10 per bottle. Assume that this will shift the demand curve to the marginal social benefit level (MSB). Move the demand curve to show this change and reposition the Social Equilibrium point to reflect the socially optimal price and quantity. Provide your answer below: 35 32.5 rice

Essentials of Economics (MindTap Course List)
8th Edition
ISBN:9781337091992
Author:N. Gregory Mankiw
Publisher:N. Gregory Mankiw
Chapter10: Externalities
Section: Chapter Questions
Problem 3PA: Greater consumption of alcohol leads to more motor vehicle accidents and, thus, imposes costs on...

Related questions
Question
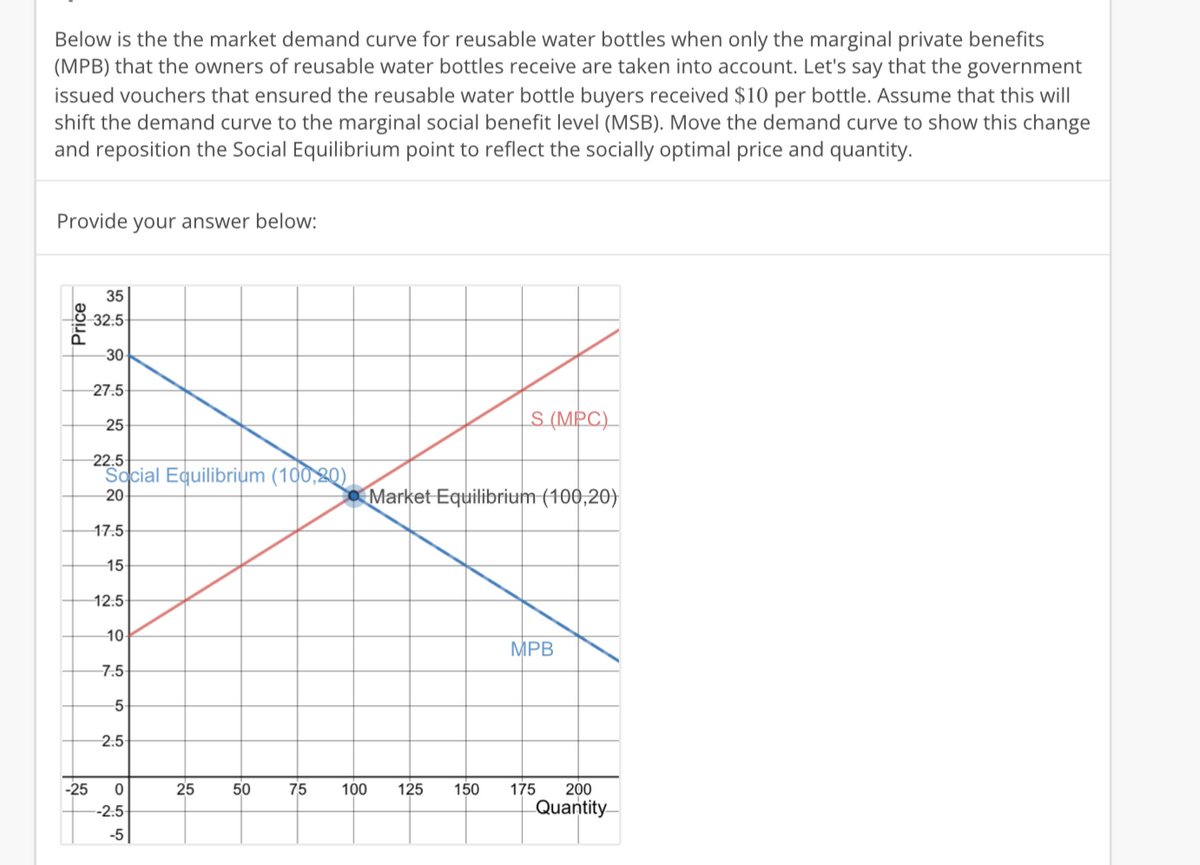
Transcribed Image Text:Below is the the market demand curve for reusable water bottles when only the marginal private benefits
(MPB) that the owners of reusable water bottles receive are taken into account. Let's say that the government
issued vouchers that ensured the reusable water bottle buyers received $10 per bottle. Assume that this will
shift the demand curve to the marginal social benefit level (MSB). Move the demand curve to show this change
and reposition the Social Equilibrium point to reflect the socially optimal price and quantity.
Provide
your answer below:
35
32:5
30
27.5
S (MPC)
25
22.5
Sacial Equilibrium (100,20)
Market Equilibrium (100,20)
20
17.5
15
12.5
10
MPB
7.5
5-
2.5
-25
25
50
75
100
125
150
175
200
--2.5
Quantity
-5
Price
Expert Solution
Step 1

Trending now
This is a popular solution!

Step by step
Solved in 5 steps with 5 images

Knowledge Booster


Learn more about
Need a deep-dive on the concept behind this application? Look no further. Learn more about this topic, economics and related others by exploring similar questions and additional content below.Recommended textbooks for you
Essentials of Economics (MindTap Course List)
Economics
ISBN:
9781337091992
Author:
N. Gregory Mankiw
Publisher:
Cengage Learning

Economics: Private and Public Choice (MindTap Cou…
Economics
ISBN:
9781305506725
Author:
James D. Gwartney, Richard L. Stroup, Russell S. Sobel, David A. Macpherson
Publisher:
Cengage Learning

Microeconomics: Private and Public Choice (MindTa…
Economics
ISBN:
9781305506893
Author:
James D. Gwartney, Richard L. Stroup, Russell S. Sobel, David A. Macpherson
Publisher:
Cengage Learning
Essentials of Economics (MindTap Course List)
Economics
ISBN:
9781337091992
Author:
N. Gregory Mankiw
Publisher:
Cengage Learning
Economics: Private and Public Choice (MindTap Cou…
Economics
ISBN:
9781305506725
Author:
James D. Gwartney, Richard L. Stroup, Russell S. Sobel, David A. Macpherson
Publisher:
Cengage Learning
Microeconomics: Private and Public Choice (MindTa…
Economics
ISBN:
9781305506893
Author:
James D. Gwartney, Richard L. Stroup, Russell S. Sobel, David A. Macpherson
Publisher:
Cengage Learning

Macroeconomics: Private and Public Choice (MindTa…
Economics
ISBN:
9781305506756
Author:
James D. Gwartney, Richard L. Stroup, Russell S. Sobel, David A. Macpherson
Publisher:
Cengage Learning