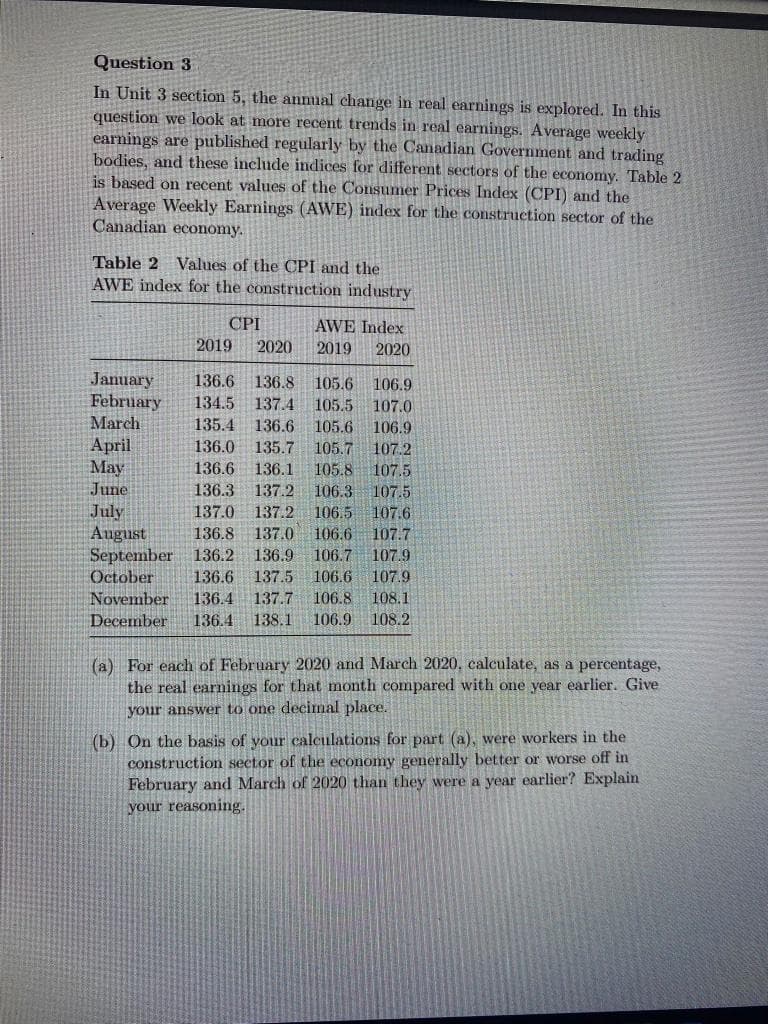
Question 3 In Unit 3 section 5, the annual change in real earnings is explored. In this question we look at more recent trends in real earnings. Average weekly earnings are published regularly by the Canadian Government and trading bodies, and these include indices for different sectors of the economy. Table 2 is based on recent values of the Consumer Prices Index (CPI) and the Average Weekly Earnings (AWE) index for the construction sector of the Canadian economy. Table 2 Values of the CPI and the AWE index for the construction industry CPI AWE Index 2019 2020 2019 2020 January February 136.6 136.8 105.6 106.9 134.5 137.4 105.5 107.0 March 135.4 136.6 105.6 106.9 Аpril May June 105.7 105.8 136.0 107.2 107.5 135.7 136.6 136.1 136.3 137.2 106.3 107.5 107.6 137.0 137.2 106.5 136.8 July August September October 106.6 106.7 107.9 137.0 107.7 136.2 136.9 136.6 136.4 137.5 137.7 106.6 106.8 107.9 November 108.1 December 136.4 138.1 106.9 108.2 (a) For each of February 2020 and March 2020, calculate, as a percentage, the real earnings for that month compared with one year earlier. Give your answer to one decimal place. (b) On the basis of your calculations for part (a), were workers in the construction sector of the economy generally better or worse off in February and March of 2020 than they were a year earlier? Explain your reasoning.
Question 3 In Unit 3 section 5, the annual change in real earnings is explored. In this question we look at more recent trends in real earnings. Average weekly earnings are published regularly by the Canadian Government and trading bodies, and these include indices for different sectors of the economy. Table 2 is based on recent values of the Consumer Prices Index (CPI) and the Average Weekly Earnings (AWE) index for the construction sector of the Canadian economy. Table 2 Values of the CPI and the AWE index for the construction industry CPI AWE Index 2019 2020 2019 2020 January February 136.6 136.8 105.6 106.9 134.5 137.4 105.5 107.0 March 135.4 136.6 105.6 106.9 Аpril May June 105.7 105.8 136.0 107.2 107.5 135.7 136.6 136.1 136.3 137.2 106.3 107.5 107.6 137.0 137.2 106.5 136.8 July August September October 106.6 106.7 107.9 137.0 107.7 136.2 136.9 136.6 136.4 137.5 137.7 106.6 106.8 107.9 November 108.1 December 136.4 138.1 106.9 108.2 (a) For each of February 2020 and March 2020, calculate, as a percentage, the real earnings for that month compared with one year earlier. Give your answer to one decimal place. (b) On the basis of your calculations for part (a), were workers in the construction sector of the economy generally better or worse off in February and March of 2020 than they were a year earlier? Explain your reasoning.

Chapter1: Making Economics Decisions
Section: Chapter Questions
Problem 1QTC

Related questions
Question
Transcribed Image Text:Question 3
In Unit 3 section 5, the annual change in real earnings is explored. In this
question we look at more recent trends in real earnings. Average weekly
earnings are published regularly by the Canadian Government and trading
bodies, and these include indices for different sectors of the economy. Table 2
is based on recent values of the Consumer Prices Index (CPI) and the
Average Weekly Earnings (AWE) index for the construction sector of the
Canadian economy.
Table 2 Values of the CPI and the
AWE index for the construction industry
CPI
AWE Index
2019
2020
2019
2020
January
February
136.6
136.8
105.6
106.9
134.5
137.4
105.5
107.0
March
135.4 136.6
105.6
106.9
Аpril
May
June
105.7
105.8
136.0
107.2
107.5
135.7
136.6 136.1
136.3 137.2
106.3 107.5
107.6
137.0 137.2 106.5
136.8
July
August
September
October
106.6
106.7 107.9
137.0
107.7
136.2
136.9
136.6
136.4
137.5
137.7
106.6
106.8
107.9
November
108.1
December
136.4
138.1
106.9 108.2
(a) For each of February 2020 and March 2020, calculate, as a percentage,
the real earnings for that month compared with one year earlier. Give
your answer to one decimal place.
(b) On the basis of your calculations for part (a), were workers in the
construction sector of the economy generally better or worse off in
February and March of 2020 than they were a year earlier? Explain
your reasoning.
Expert Solution
This question has been solved!
Explore an expertly crafted, step-by-step solution for a thorough understanding of key concepts.

Step by step
Solved in 2 steps

Knowledge Booster


Learn more about
Need a deep-dive on the concept behind this application? Look no further. Learn more about this topic, economics and related others by exploring similar questions and additional content below.Recommended textbooks for you

Principles of Economics (12th Edition)
Economics
ISBN:
9780134078779
Author:
Karl E. Case, Ray C. Fair, Sharon E. Oster
Publisher:
PEARSON

Engineering Economy (17th Edition)
Economics
ISBN:
9780134870069
Author:
William G. Sullivan, Elin M. Wicks, C. Patrick Koelling
Publisher:
PEARSON
Principles of Economics (12th Edition)
Economics
ISBN:
9780134078779
Author:
Karl E. Case, Ray C. Fair, Sharon E. Oster
Publisher:
PEARSON
Engineering Economy (17th Edition)
Economics
ISBN:
9780134870069
Author:
William G. Sullivan, Elin M. Wicks, C. Patrick Koelling
Publisher:
PEARSON

Principles of Economics (MindTap Course List)
Economics
ISBN:
9781305585126
Author:
N. Gregory Mankiw
Publisher:
Cengage Learning

Managerial Economics: A Problem Solving Approach
Economics
ISBN:
9781337106665
Author:
Luke M. Froeb, Brian T. McCann, Michael R. Ward, Mike Shor
Publisher:
Cengage Learning

Managerial Economics & Business Strategy (Mcgraw-…
Economics
ISBN:
9781259290619
Author:
Michael Baye, Jeff Prince
Publisher:
McGraw-Hill Education