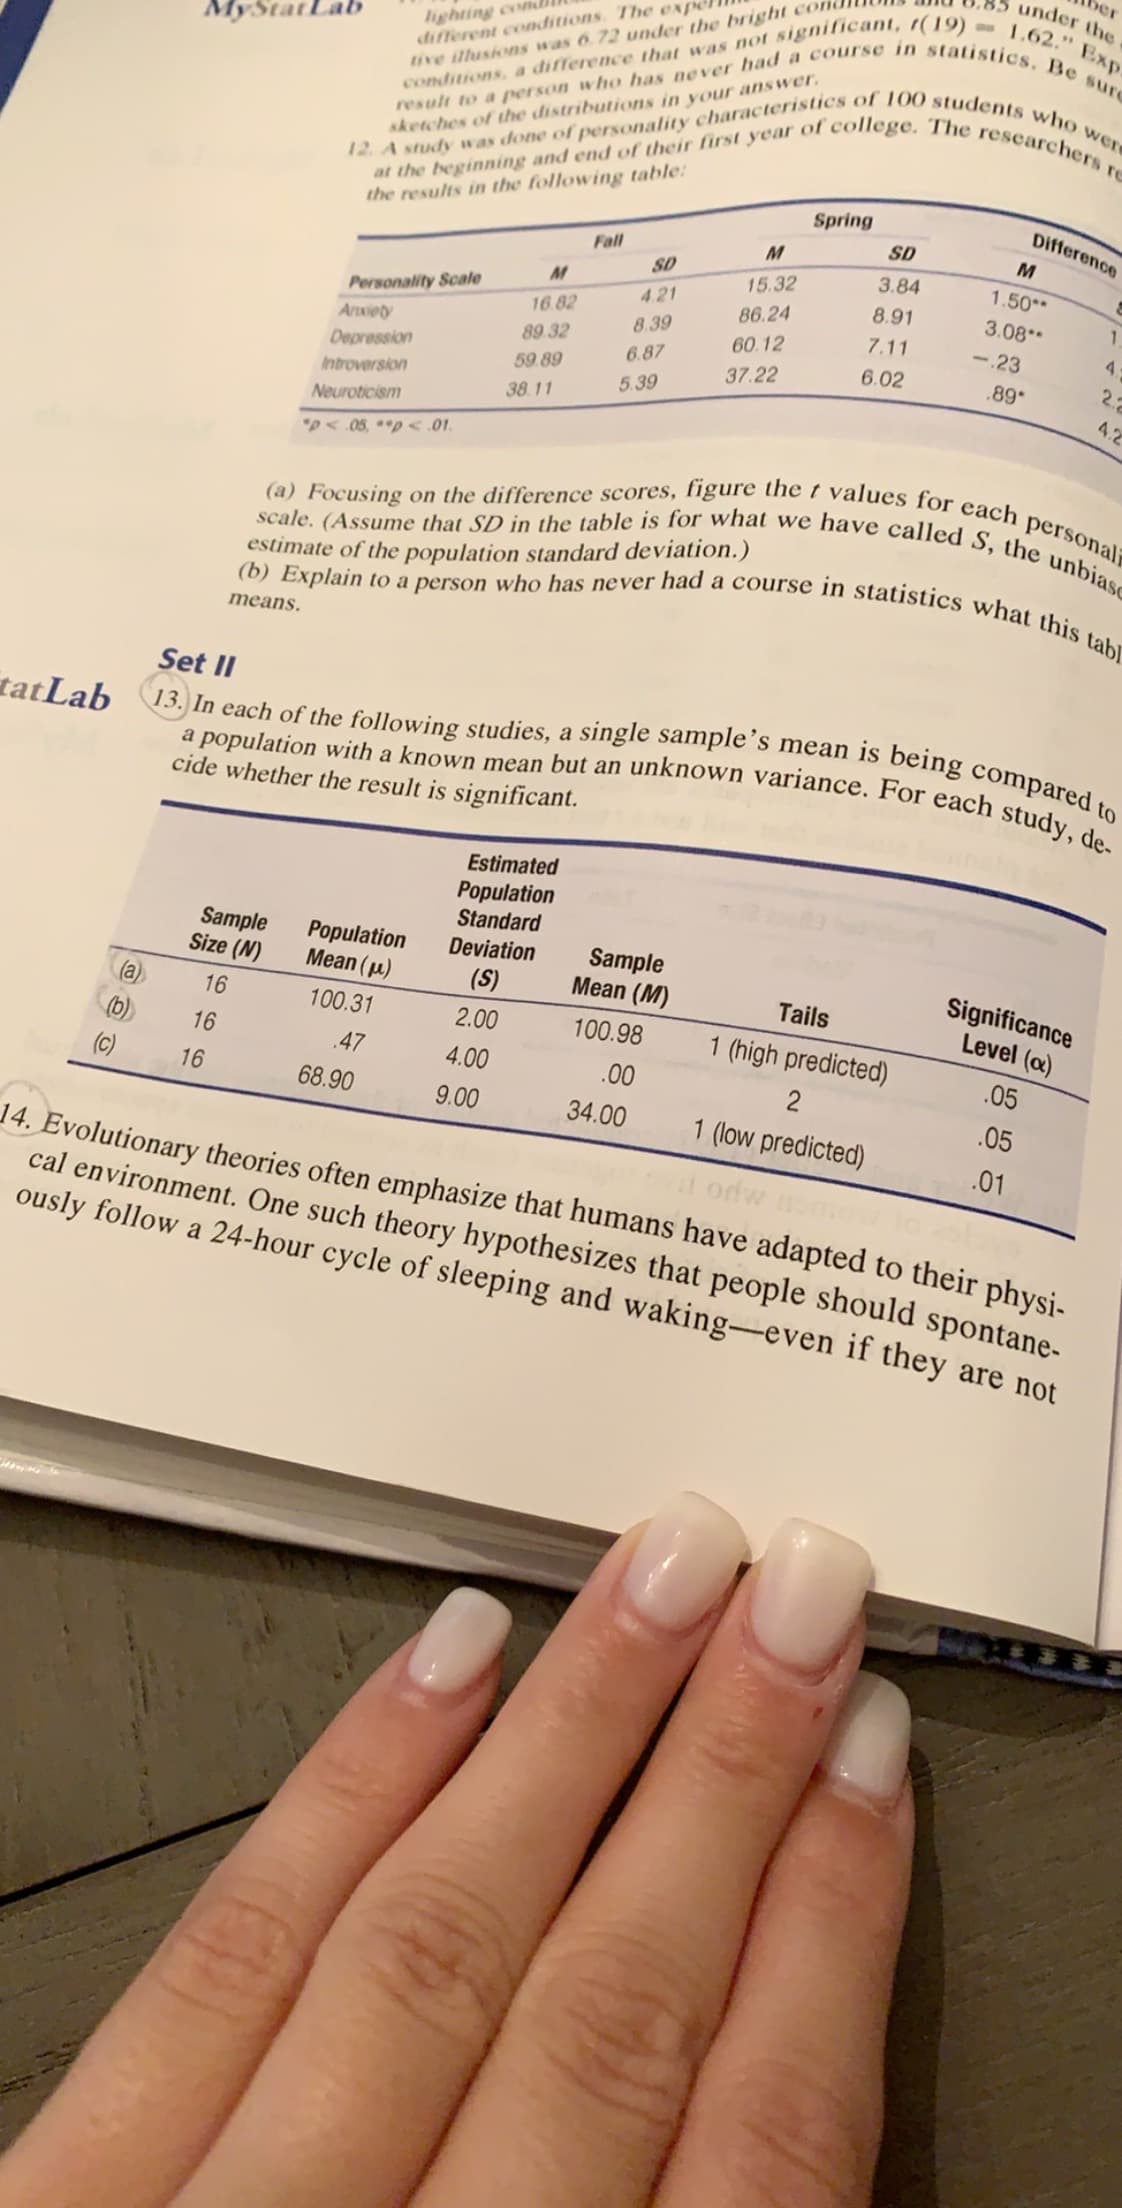
ber under the ighting con. different conditions The expe tive illusions was 6.72 under the bright co MyStatLab conditions, a difference that was not significant, r(19)-1.62." Exp result to a person who has never had a course in statistics. Be sur researchers re The 'college at the beginning and end of their first year of the results in the following table 12 A study was done of personality characteristics of 100 students who were sketches of the distributions in your answer Difference Spring SD M Fall 3.84 SD 1.50* 15.32 Personality Scale Anxiety Depression 4.21 8.91 3.08 1 86.24 16.82 8.39 7.11 -23 60.12 89 32 6.87 6.02 22 89* 37.22 59 89 5.39 4.2 Introversion 38.11 Neuroticism DA 05,p<.01 (a) Focusing on the difference scores, figure the t values for each personal scale. (Assume that SD in the table is for what we have called S, the unbiase (b) Explain to a person who has never had a course in statistics what this tabl estimate of the population standard deviation.) means Set II 13. In each of the following studies, a single sample's mean is being compared to a population with a known mean but an unknown variance. For each study, de- tatLab cide whether the result is significant. Estimated Population Standard Sample Size (N) Population Mean (u) Sample Mean (M) Deviation Significance Level (a) (S) Tails (a) 16 100.31 2.00 100.98 1 (high predicted) (b) 16 05 .47 4.00 .00 2 16 68.90 .05 9.00 34.00 1 (low predicted) .01 14. Evolutionary theories often emphasize that humans have adapted to their physi cal environment. One such theory hypothesizes that people should spontane- ously follow a 24-hour cycle of sleeping and waking-even if they are not 99
ber under the ighting con. different conditions The expe tive illusions was 6.72 under the bright co MyStatLab conditions, a difference that was not significant, r(19)-1.62." Exp result to a person who has never had a course in statistics. Be sur researchers re The 'college at the beginning and end of their first year of the results in the following table 12 A study was done of personality characteristics of 100 students who were sketches of the distributions in your answer Difference Spring SD M Fall 3.84 SD 1.50* 15.32 Personality Scale Anxiety Depression 4.21 8.91 3.08 1 86.24 16.82 8.39 7.11 -23 60.12 89 32 6.87 6.02 22 89* 37.22 59 89 5.39 4.2 Introversion 38.11 Neuroticism DA 05,p<.01 (a) Focusing on the difference scores, figure the t values for each personal scale. (Assume that SD in the table is for what we have called S, the unbiase (b) Explain to a person who has never had a course in statistics what this tabl estimate of the population standard deviation.) means Set II 13. In each of the following studies, a single sample's mean is being compared to a population with a known mean but an unknown variance. For each study, de- tatLab cide whether the result is significant. Estimated Population Standard Sample Size (N) Population Mean (u) Sample Mean (M) Deviation Significance Level (a) (S) Tails (a) 16 100.31 2.00 100.98 1 (high predicted) (b) 16 05 .47 4.00 .00 2 16 68.90 .05 9.00 34.00 1 (low predicted) .01 14. Evolutionary theories often emphasize that humans have adapted to their physi cal environment. One such theory hypothesizes that people should spontane- ously follow a 24-hour cycle of sleeping and waking-even if they are not 99

MATLAB: An Introduction with Applications
6th Edition
ISBN:9781119256830
Author:Amos Gilat
Publisher:Amos Gilat
Chapter1: Starting With Matlab
Section: Chapter Questions
Problem 1P

Related questions
Topic Video
Question
100%
In each of the following studies, a single samples
Transcribed Image Text:ber
under the
ighting con.
different conditions The expe
tive illusions was 6.72 under the bright co
MyStatLab
conditions, a difference that was not significant, r(19)-1.62." Exp
result to a person who has never had a course in statistics. Be sur
researchers re
The
'college
at the beginning and end of their first year of
the results in the following table
12 A study was done of personality characteristics of 100 students who were
sketches of the distributions in your answer
Difference
Spring
SD
M
Fall
3.84
SD
1.50*
15.32
Personality Scale
Anxiety
Depression
4.21
8.91
3.08
1
86.24
16.82
8.39
7.11
-23
60.12
89 32
6.87
6.02
22
89*
37.22
59 89
5.39
4.2
Introversion
38.11
Neuroticism
DA 05,p<.01
(a) Focusing on the difference scores, figure the t values for each personal
scale. (Assume that SD in the table is for what we have called S, the unbiase
(b) Explain to a person who has never had a course in statistics what this tabl
estimate of the population standard deviation.)
means
Set II
13. In each of the following studies, a single sample's mean is being compared to
a population with a known mean but an unknown variance. For each study, de-
tatLab
cide whether the result is significant.
Estimated
Population
Standard
Sample
Size (N)
Population
Mean (u)
Sample
Mean (M)
Deviation
Significance
Level (a)
(S)
Tails
(a)
16
100.31
2.00
100.98
1 (high predicted)
(b)
16
05
.47
4.00
.00
2
16
68.90
.05
9.00
34.00
1 (low predicted)
.01
14. Evolutionary theories often emphasize that humans have adapted to their physi
cal environment. One such theory hypothesizes that people should spontane-
ously follow a 24-hour cycle of sleeping and waking-even if they are not
99
Expert Solution
This question has been solved!
Explore an expertly crafted, step-by-step solution for a thorough understanding of key concepts.

This is a popular solution!

Trending now
This is a popular solution!

Step by step
Solved in 5 steps with 2 images

Knowledge Booster


Learn more about
Need a deep-dive on the concept behind this application? Look no further. Learn more about this topic, statistics and related others by exploring similar questions and additional content below.Recommended textbooks for you
MATLAB: An Introduction with Applications
Statistics
ISBN:
9781119256830
Author:
Amos Gilat
Publisher:
John Wiley & Sons Inc

Probability and Statistics for Engineering and th…
Statistics
ISBN:
9781305251809
Author:
Jay L. Devore
Publisher:
Cengage Learning

Statistics for The Behavioral Sciences (MindTap C…
Statistics
ISBN:
9781305504912
Author:
Frederick J Gravetter, Larry B. Wallnau
Publisher:
Cengage Learning
MATLAB: An Introduction with Applications
Statistics
ISBN:
9781119256830
Author:
Amos Gilat
Publisher:
John Wiley & Sons Inc
Probability and Statistics for Engineering and th…
Statistics
ISBN:
9781305251809
Author:
Jay L. Devore
Publisher:
Cengage Learning
Statistics for The Behavioral Sciences (MindTap C…
Statistics
ISBN:
9781305504912
Author:
Frederick J Gravetter, Larry B. Wallnau
Publisher:
Cengage Learning

Elementary Statistics: Picturing the World (7th E…
Statistics
ISBN:
9780134683416
Author:
Ron Larson, Betsy Farber
Publisher:
PEARSON

The Basic Practice of Statistics
Statistics
ISBN:
9781319042578
Author:
David S. Moore, William I. Notz, Michael A. Fligner
Publisher:
W. H. Freeman

Introduction to the Practice of Statistics
Statistics
ISBN:
9781319013387
Author:
David S. Moore, George P. McCabe, Bruce A. Craig
Publisher:
W. H. Freeman