BIOSTATISTICS CASE STUDY: Tests of Association for Categorical Data Table 1 Characteristics of 399 patients with PTB and univariate analyses of potential predictors of successful treatment Successful Characteristics Patients treatment n (%) n(96) Pvalue* Sex 0.392 Male 293 (73.4) 106 (26.6) 198 (67.6) 77 (72.6) Female Patients with comorbidities 0.018 No comorbidity With comorbidities Unknown 143 (35.9) 255 (64.1) 109 (76.2) 165 (64.7) 1 (100) CXR 0.015 Cavitations No cavitation Unknown 127 (31.9) 271 (68.1) 98 (77.2) 176 (64.9) 1 (100) Previous TB treatment 0.815 Yes No Unknown 22 (5.8) 16 (72.7) 360 (94.2) 246 (68.3) 12 (70.6) 17 DOT 0.002 Yes No Unknown 250 (63.1) 186 (74.4 3 (100) 146 (36.9) 86 (58.9) Diagnostic and treating physicians <0.001 298 (74.7) 221 (74.2) Pulmonologist Non-pulmonologist 102 (25.6) 55 (53.9) Health-care institutions <0.001 105 (26.3) 68 (64.8) Medical centre Regional hospital District hospital and 144 (36.1) 98 (24.6) 399 (100) *15-month follow-up after start of treatment. 92 (63.9) 66 (67.3) Chest specialty hospital52 (13.0) 49 (94.2) primary practitioners Total 275 (68.9) tx2 test. PTB pulmonary tuberculosis; CXR chest X-ray, TB tuberculosis; DOT- directly observed treatment. Page i ot 4
BIOSTATISTICS CASE STUDY: Tests of Association for Categorical Data Table 1 Characteristics of 399 patients with PTB and univariate analyses of potential predictors of successful treatment Successful Characteristics Patients treatment n (%) n(96) Pvalue* Sex 0.392 Male 293 (73.4) 106 (26.6) 198 (67.6) 77 (72.6) Female Patients with comorbidities 0.018 No comorbidity With comorbidities Unknown 143 (35.9) 255 (64.1) 109 (76.2) 165 (64.7) 1 (100) CXR 0.015 Cavitations No cavitation Unknown 127 (31.9) 271 (68.1) 98 (77.2) 176 (64.9) 1 (100) Previous TB treatment 0.815 Yes No Unknown 22 (5.8) 16 (72.7) 360 (94.2) 246 (68.3) 12 (70.6) 17 DOT 0.002 Yes No Unknown 250 (63.1) 186 (74.4 3 (100) 146 (36.9) 86 (58.9) Diagnostic and treating physicians <0.001 298 (74.7) 221 (74.2) Pulmonologist Non-pulmonologist 102 (25.6) 55 (53.9) Health-care institutions <0.001 105 (26.3) 68 (64.8) Medical centre Regional hospital District hospital and 144 (36.1) 98 (24.6) 399 (100) *15-month follow-up after start of treatment. 92 (63.9) 66 (67.3) Chest specialty hospital52 (13.0) 49 (94.2) primary practitioners Total 275 (68.9) tx2 test. PTB pulmonary tuberculosis; CXR chest X-ray, TB tuberculosis; DOT- directly observed treatment. Page i ot 4

College Algebra (MindTap Course List)
12th Edition
ISBN:9781305652231
Author:R. David Gustafson, Jeff Hughes
Publisher:R. David Gustafson, Jeff Hughes
Chapter8: Sequences, Series, And Probability
Section8.7: Probability
Problem 58E: What is meant by the sample space of an experiment?

Related questions

Question
100%
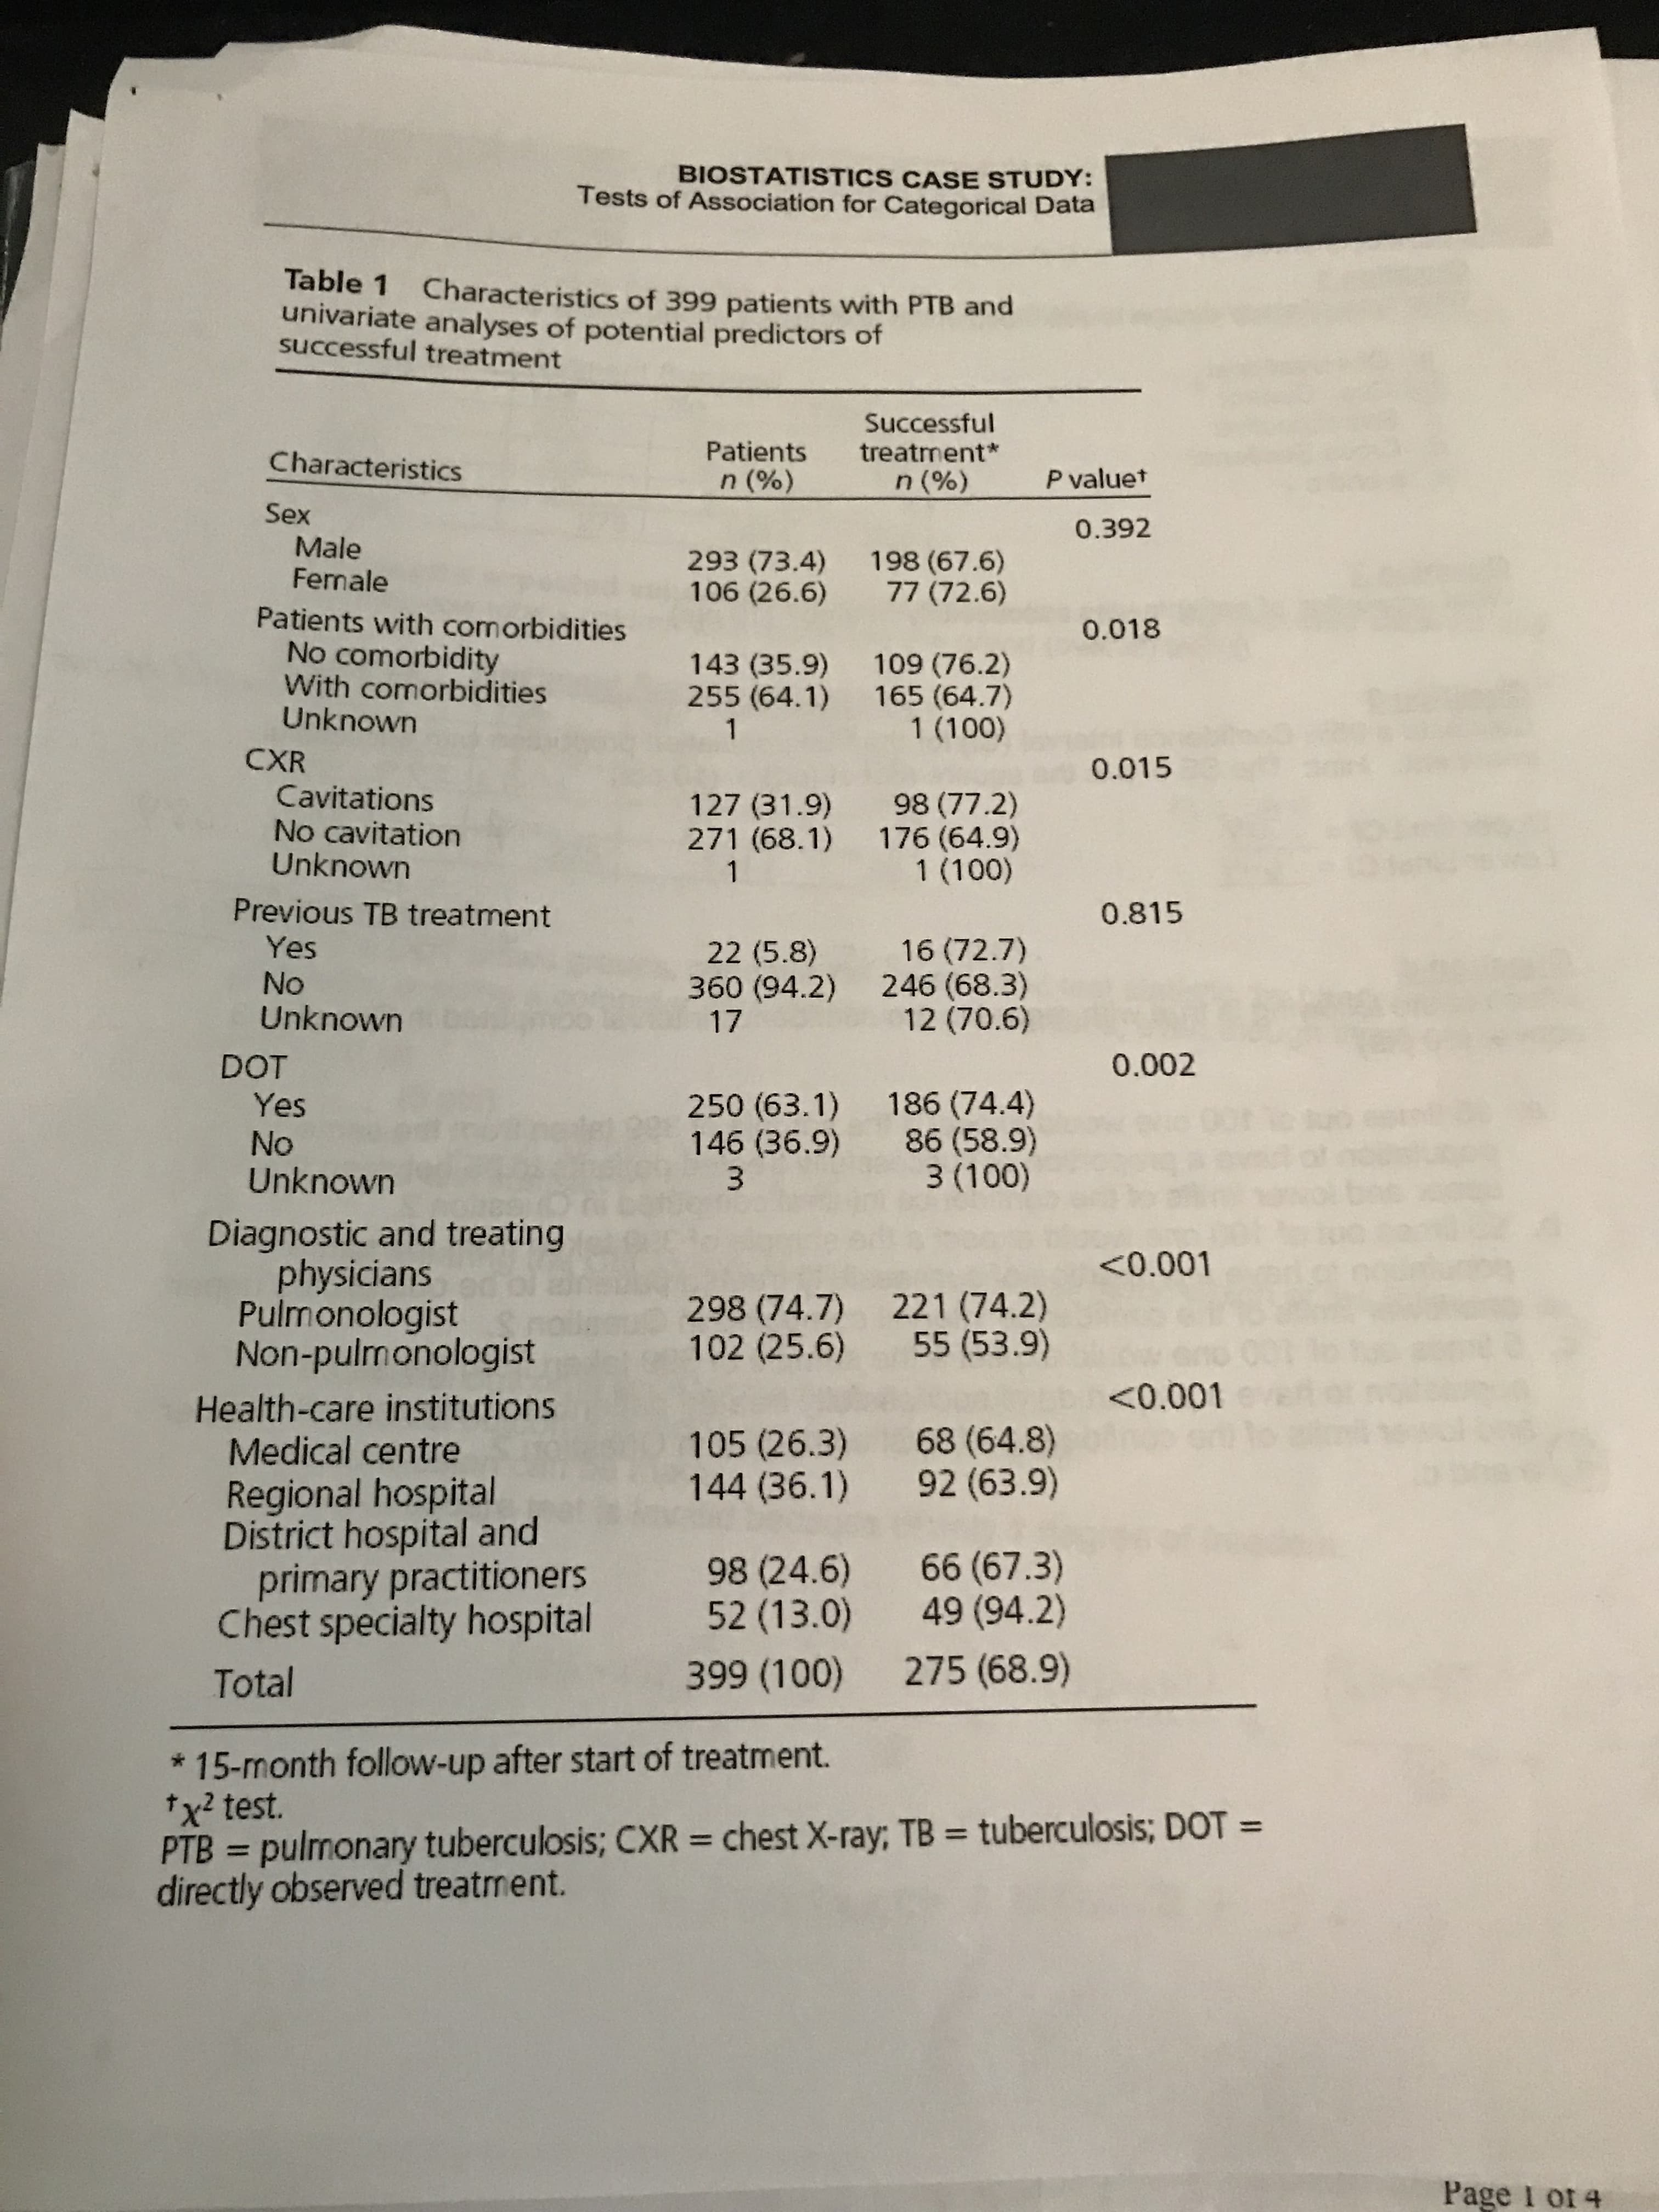
According to table 1, What is the 95% confidence interval for the true proportion with successful treatment?
Upper Limit?
Lower Limit?
Transcribed Image Text:BIOSTATISTICS CASE STUDY:
Tests of Association for Categorical Data
Table 1 Characteristics of 399 patients with PTB and
univariate analyses of potential predictors of
successful treatment
Successful
Characteristics
Patients treatment
n (%)
n(96)
Pvalue*
Sex
0.392
Male
293 (73.4)
106 (26.6)
198 (67.6)
77 (72.6)
Female
Patients with comorbidities
0.018
No comorbidity
With comorbidities
Unknown
143 (35.9)
255 (64.1)
109 (76.2)
165 (64.7)
1 (100)
CXR
0.015
Cavitations
No cavitation
Unknown
127 (31.9)
271 (68.1)
98 (77.2)
176 (64.9)
1 (100)
Previous TB treatment
0.815
Yes
No
Unknown
22 (5.8) 16 (72.7)
360 (94.2) 246 (68.3)
12 (70.6)
17
DOT
0.002
Yes
No
Unknown
250 (63.1) 186 (74.4
3 (100)
146 (36.9)
86 (58.9)
Diagnostic and treating
physicians
<0.001
298 (74.7)
221 (74.2)
Pulmonologist
Non-pulmonologist
102 (25.6)
55 (53.9)
Health-care institutions
<0.001
105 (26.3)
68 (64.8)
Medical centre
Regional hospital
District hospital and
144 (36.1)
98 (24.6)
399 (100)
*15-month follow-up after start of treatment.
92 (63.9)
66 (67.3)
Chest specialty hospital52 (13.0) 49 (94.2)
primary practitioners
Total
275 (68.9)
tx2 test.
PTB pulmonary tuberculosis; CXR chest X-ray, TB tuberculosis; DOT-
directly observed treatment.
Page i ot 4
Expert Solution
This question has been solved!
Explore an expertly crafted, step-by-step solution for a thorough understanding of key concepts.

This is a popular solution!

Trending now
This is a popular solution!

Step by step
Solved in 4 steps with 3 images

Knowledge Booster


Learn more about
Need a deep-dive on the concept behind this application? Look no further. Learn more about this topic, statistics and related others by exploring similar questions and additional content below.Recommended textbooks for you
College Algebra (MindTap Course List)
Algebra
ISBN:
9781305652231
Author:
R. David Gustafson, Jeff Hughes
Publisher:
Cengage Learning
College Algebra (MindTap Course List)
Algebra
ISBN:
9781305652231
Author:
R. David Gustafson, Jeff Hughes
Publisher:
Cengage Learning