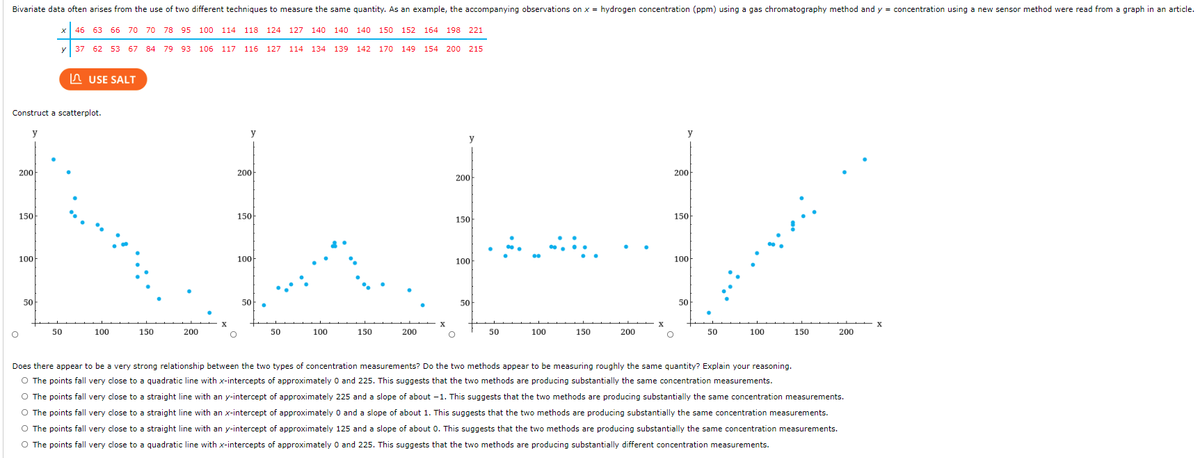
Bivariate data often arises from the use of two different techniques to measure the same quantity. As an example, the accompanying observations on x hydrogen concentration (ppm) using a gas chromatography method and y concentration using a new sensor method were read from a graph in an article. 46 63 66 70 70 78 95 100 114 118 124 127 140 140 140 150 152 164 198 221 37 62 53 67 84 79 93 106 117 116 127 114 134 139 142 170 149 154 200 215 Construct a scatterplot. 200 200 150 BLEK 100 50 150 200 150 100 LAUSE SALT 50 50 100 150 200 200 150 100 50 50 100 50 100 150 200 200 150 100 50 100 Does there appear to be a very strong relationship between the two types of concentration measurements? Do the two methods appear to be measuring roughly the same quantity? Explain your reasoning. O The points fall very close to a quadratic line with x-intercepts of approximately 0 and 225. This suggests that the two methods are producing substantially the same concentration measurements. 150 200 O The points fall very close to a straight line with an y-intercept of approximately 225 and a slope of about -1. This suggests that the two methods are producing substantially the same concentration measurements. O The points fall very close to a straight line with an x-intercept of approximately 0 and a slope of about 1. This suggests that the two methods are producing substantially the same concentration measurements. O The points fall very close to a straight line with an y-intercept of approximately 125 and a slope of about 0. This suggests that the two methods are producing substantially the same concentration measurements. O The points fall very close to a quadratic line with x-intercepts of approximately 0 and 225. This suggests that the two methods are producing substantially different concentration measurements. X
Bivariate data often arises from the use of two different techniques to measure the same quantity. As an example, the accompanying observations on x hydrogen concentration (ppm) using a gas chromatography method and y concentration using a new sensor method were read from a graph in an article. 46 63 66 70 70 78 95 100 114 118 124 127 140 140 140 150 152 164 198 221 37 62 53 67 84 79 93 106 117 116 127 114 134 139 142 170 149 154 200 215 Construct a scatterplot. 200 200 150 BLEK 100 50 150 200 150 100 LAUSE SALT 50 50 100 150 200 200 150 100 50 50 100 50 100 150 200 200 150 100 50 100 Does there appear to be a very strong relationship between the two types of concentration measurements? Do the two methods appear to be measuring roughly the same quantity? Explain your reasoning. O The points fall very close to a quadratic line with x-intercepts of approximately 0 and 225. This suggests that the two methods are producing substantially the same concentration measurements. 150 200 O The points fall very close to a straight line with an y-intercept of approximately 225 and a slope of about -1. This suggests that the two methods are producing substantially the same concentration measurements. O The points fall very close to a straight line with an x-intercept of approximately 0 and a slope of about 1. This suggests that the two methods are producing substantially the same concentration measurements. O The points fall very close to a straight line with an y-intercept of approximately 125 and a slope of about 0. This suggests that the two methods are producing substantially the same concentration measurements. O The points fall very close to a quadratic line with x-intercepts of approximately 0 and 225. This suggests that the two methods are producing substantially different concentration measurements. X

Linear Algebra: A Modern Introduction
4th Edition
ISBN:9781285463247
Author:David Poole
Publisher:David Poole
Chapter4: Eigenvalues And Eigenvectors
Section4.6: Applications And The Perron-frobenius Theorem
Problem 22EQ

Related questions
Question
Q2
Transcribed Image Text:Bivariate data often arises from the use of two different techniques to measure the same quantity. As an example, the accompanying observations on x = hydrogen concentration (ppm) using a gas chromatography method and y = concentration using a new sensor method were read from a graph in an article.
O
Construct a scatterplot.
y
200
150
100
46 63 66 70 70 78 95 100 114 118 124
y 37 62 53 67
50
USE SALT
50
127 140 140 140 150 152 164 198 221
84 79 93 106 117 116 127 114 134 139 142 170 149 154 200 215
100
150
200
y
200
150
100
O
50
50
100
150
200
X
y
200
150
100
O
50
50
100
150
200
X
200
150
100
O
50
●
50
100
150
200
Does there appear to be a very strong relationship between the two types of concentration measurements? Do the two methods appear to be measuring roughly the same quantity? Explain your reasoning.
O The points fall very close to a quadratic line with x-intercepts of approximately 0 and 225. This suggests that the two methods are producing substantially the same concentration measurements.
O The points fall very close to a straight line with an y-intercept of approximately 225 and a slope of about 1. This suggests that the two methods are producing substantially the same concentration measurements.
O The points fall very close to a straight line with an x-intercept of approximately 0 and a slope of about 1. This suggests that the two methods are producing substantially the same concentration measurements.
O The points fall very close to a straight line with an y-intercept of approximately 125 and a slope of about 0. This suggests that the two methods are producing substantially the same concentration measurements.
O The points fall very close to a quadratic line with x-intercepts of approximately 0 and 225. This suggests that the two methods are producing substantially different concentration measurements.
X
Expert Solution
This question has been solved!
Explore an expertly crafted, step-by-step solution for a thorough understanding of key concepts.

Step by step
Solved in 4 steps with 2 images

Recommended textbooks for you
Linear Algebra: A Modern Introduction
Algebra
ISBN:
9781285463247
Author:
David Poole
Publisher:
Cengage Learning

Functions and Change: A Modeling Approach to Coll…
Algebra
ISBN:
9781337111348
Author:
Bruce Crauder, Benny Evans, Alan Noell
Publisher:
Cengage Learning

Glencoe Algebra 1, Student Edition, 9780079039897…
Algebra
ISBN:
9780079039897
Author:
Carter
Publisher:
McGraw Hill
Linear Algebra: A Modern Introduction
Algebra
ISBN:
9781285463247
Author:
David Poole
Publisher:
Cengage Learning
Functions and Change: A Modeling Approach to Coll…
Algebra
ISBN:
9781337111348
Author:
Bruce Crauder, Benny Evans, Alan Noell
Publisher:
Cengage Learning
Glencoe Algebra 1, Student Edition, 9780079039897…
Algebra
ISBN:
9780079039897
Author:
Carter
Publisher:
McGraw Hill

Big Ideas Math A Bridge To Success Algebra 1: Stu…
Algebra
ISBN:
9781680331141
Author:
HOUGHTON MIFFLIN HARCOURT
Publisher:
Houghton Mifflin Harcourt