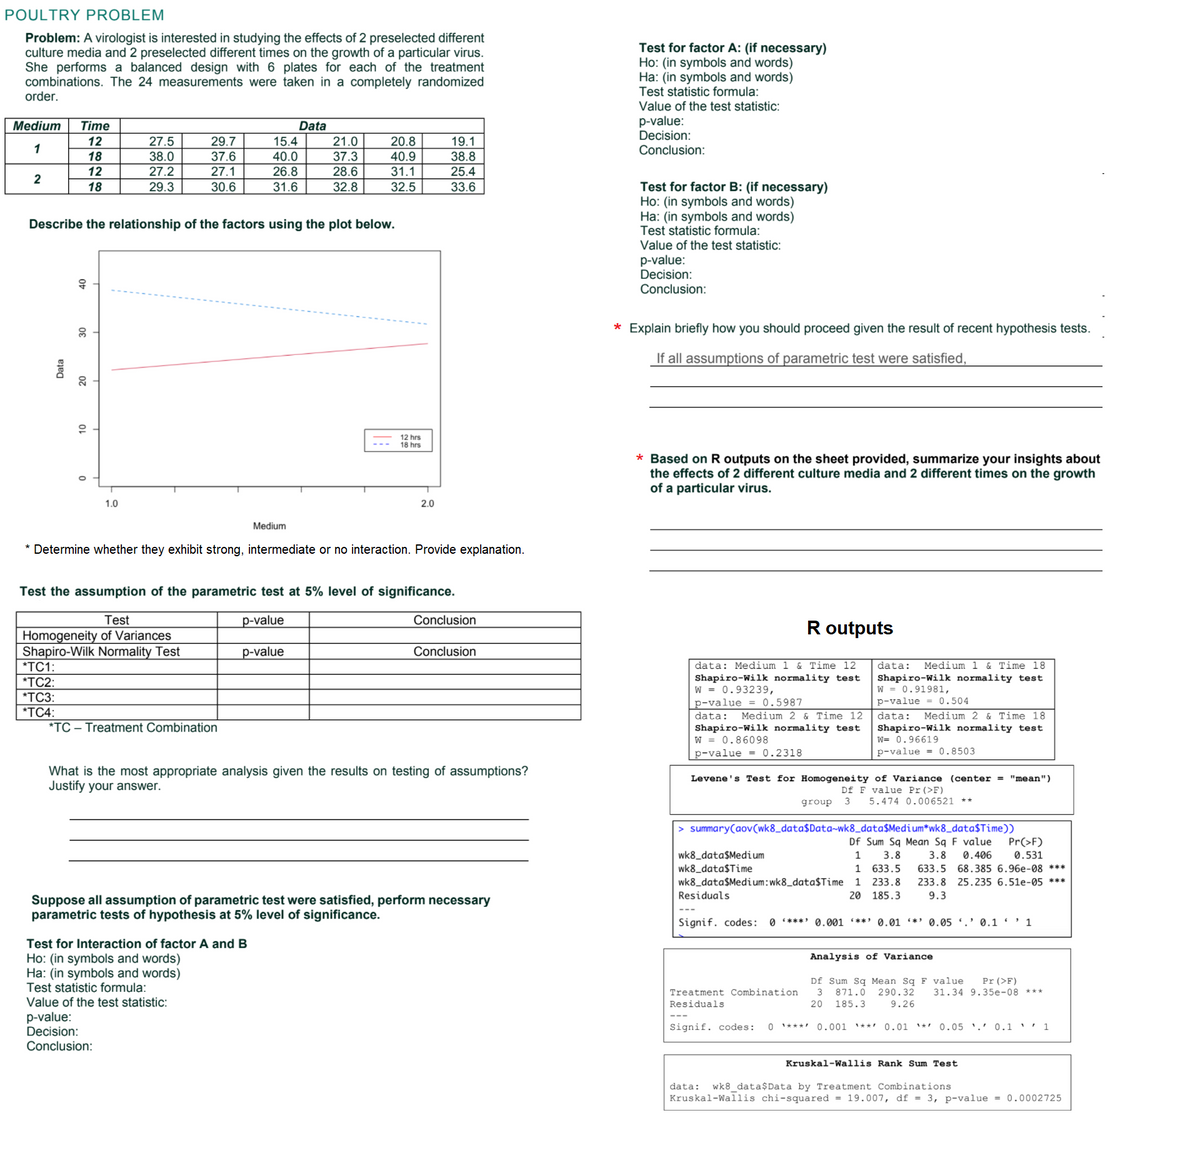
blem: rologis studying the elect culture media and 2 preselected different times on the growth of a particular virus. She performs a balanced design with 6 plates for each of the treatment combinations. The 24 measurements were taken in a completely randomized order. Medium Time 12 1 2 륨 18 12 18 9 8 2 27.5 38.0 27.2 29.3 24 29.7 37.6 27.1 30.6 Describe the relationship of the factors using the plot below. 15.4 40.0 26.8 31.6 Data 21.0 37.3 28.6 32.8 20.8 40.9 31.1 32.5 12 hrs 18 hrs 19.1 38.8 25.4 33.6 Test for factor A: (if necessary) Ho: (in symbols and words) Ha: (in symbols and words) Test statistic formula: Value of the test statistic: p-value: Decision: Conclusion: Test for factor B: (if necessary) Ho: (in symbols and words) Ha: (in symbols and words) Test statistic formula: Value of the test statistic: p-value: Decision: Conclusion: * Explain briefly how you should proceed given the result of recent hypothesis tests. If all assumptions of parametric test were satisfied, * Based on R outputs on the sheet provided, summarize your insights about the effects of 2 different culture media and 2 different times on the growth of a particular virus.
blem: rologis studying the elect culture media and 2 preselected different times on the growth of a particular virus. She performs a balanced design with 6 plates for each of the treatment combinations. The 24 measurements were taken in a completely randomized order. Medium Time 12 1 2 륨 18 12 18 9 8 2 27.5 38.0 27.2 29.3 24 29.7 37.6 27.1 30.6 Describe the relationship of the factors using the plot below. 15.4 40.0 26.8 31.6 Data 21.0 37.3 28.6 32.8 20.8 40.9 31.1 32.5 12 hrs 18 hrs 19.1 38.8 25.4 33.6 Test for factor A: (if necessary) Ho: (in symbols and words) Ha: (in symbols and words) Test statistic formula: Value of the test statistic: p-value: Decision: Conclusion: Test for factor B: (if necessary) Ho: (in symbols and words) Ha: (in symbols and words) Test statistic formula: Value of the test statistic: p-value: Decision: Conclusion: * Explain briefly how you should proceed given the result of recent hypothesis tests. If all assumptions of parametric test were satisfied, * Based on R outputs on the sheet provided, summarize your insights about the effects of 2 different culture media and 2 different times on the growth of a particular virus.

College Algebra
7th Edition
ISBN:9781305115545
Author:James Stewart, Lothar Redlin, Saleem Watson
Publisher:James Stewart, Lothar Redlin, Saleem Watson
Chapter9: Counting And Probability
Section9.3: Binomial Probability
Problem 1E: A binomial experiment is UDC in which there are exactly __________ outcome. One outcome is called...

Related questions
Question
Answer the last two portion with the red asterisk (*)
Transcribed Image Text:POULTRY PROBLEM
Problem: A virologist is interested in studying the effects of 2 preselected different
culture media and 2 preselected different times on the growth of a particular virus.
She performs a balanced design with 6 plates for each of the treatment
combinations. The 24 measurements were taken in a completely randomized
order.
Test for factor A: (if necessary)
Ho: (in symbols and words)
Ha: (in symbols and words)
Test statistic formula:
Value of the test statistic:
推維維推
p-value:
Decision:
Conclusion:
Medium
Time
Data
12
27.5
38.0
27.2
29.7
37.6
15.4
40.0
26.8
21.0
37.3
28.6
20.8
40.9
31.1
19.1
1
18
38.8
12
27.1
25.4
2
Test for factor B: (if necessary)
Ho: (in symbols and words)
Ha: (in symbols and words)
Test statistic formula:
18
29.3
30.6
31.6
32.8
32.5
33.6
Describe the relationship of the factors using the plot below.
Value of the test statistic:
p-value:
Decision:
Co
usion:
* Explain briefly how you should proceed given the result of recent hypothesis tests.
If all assumptions of parametric test were satisfied,
20
10
12 hrs
18 hrs
* Based on R outputs on the sheet provided, summarize your insights about
the effects of 2 different culture media and 2 different times on the growth
of a particular virus.
1.0
2.0
Medium
* Determine whether they exhibit strong, intermediate or no interaction. Provide explanation.
Test the assumption of the parametric test at 5% level of significance.
Test
p-value
Conclusion
R outputs
Homogeneity of Variances
Shapiro-Wilk Normality Test
*TC1:
p-value
Conclusion
data: Medium 1 & Time 12
data:
Medium 1
& Time 18
Shapiro-Wilk normality test
W = 0.93239,
p-value = 0.5987
data:
Shapiro-Wilk normality test
W = 0.91981,
*TC2:
*TC3:
*TC4:
p-value = 0.504
Medium 2 & Time 12
data:
Medium 2 & Time 18
*TC – Treatment Combination
Shapiro-Wilk normality test
W = 0.86098
p-value = 0.2318
Shapiro-Wilk normality test
W= 0.96619
p-value = 0.8503
What is the most appropriate analysis given the results on testing of assumptions?
Justify your answer.
Levene's Test for Homogeneity of Variance (center = "mean")
Df F value Pr (>F)
group
5.474 0.006521
summary(aov(wk8_data$Data~wk8_data$Medium*wk8_data$Time))
Df Sum Sq Mean Sq F value
Pr(>F)
0.531
wk8_data$Medium
wk8_data$Time
1
3.8
3.8
0.406
1 633.5
633.5 68.385 6.96e-08 ***
wk8_data$Medium:wk8_data$Time
1
233.8
233.8 25.235 6.51e-05 ***
Residuals
20 185.3
9.3
Suppose all assumption of parametric test were satisfied, perform necessary
parametric tests of hypothesis at 5% level of significance.
Signif. codes: 0 ****' 0.001 **' 0.01 **' 0.05 '.' 0.1 ' ' 1
Test for Interaction of factor A and B
Analysis of Variance
Ho: (in symbols and words)
Ha: (in symbols and words)
Test statistic formula:
Value of the test statistic:
Df Sum Sq Mean Sg F value
871.0
Pr (>F)
31.34 9.35e-08 ***
Treatment Combination
Residuals
3
290.32
20
185.3
9.26
p-value:
Decision:
Conclusion:
Signif. codes:
0 ****! 0.001 '**' 0.01 '*
0.05 '.' 0.1 ' 1
Kruskal-Wallis Rank Sum Test
data:
wk8 data$Data by Treatment Combinations
Kruskal-Wallis chi-squared = 19.007, df = 3, p-value = 0.0002725
Data
Expert Solution
This question has been solved!
Explore an expertly crafted, step-by-step solution for a thorough understanding of key concepts.

Step by step
Solved in 5 steps with 3 images

Recommended textbooks for you
College Algebra
Algebra
ISBN:
9781305115545
Author:
James Stewart, Lothar Redlin, Saleem Watson
Publisher:
Cengage Learning

College Algebra (MindTap Course List)
Algebra
ISBN:
9781305652231
Author:
R. David Gustafson, Jeff Hughes
Publisher:
Cengage Learning
College Algebra
Algebra
ISBN:
9781305115545
Author:
James Stewart, Lothar Redlin, Saleem Watson
Publisher:
Cengage Learning
College Algebra (MindTap Course List)
Algebra
ISBN:
9781305652231
Author:
R. David Gustafson, Jeff Hughes
Publisher:
Cengage Learning