BROWS the maximum weights (in kilograms) for which one repetition of a half squat can be performed and the times (in seconds) to run a 10-meter sprint for 12 intemational soccer players. Complete parts (a) through (d) below. Click here to view the data table. Click here to view the table of critical values for the Pearson correlation coefficient. Data Table (b) Calculate the sample correlation coefficient r. r= -0.956 (Round to three decimal places as needed.) Maximum weight, x Time, y 175 1.93 (c) Describe the type of correlation, if any, and interpret the correlation in the context of the data. 170 1.91 145 2.16 There is a strong negative linear correlation. 205 1.55 145 2.17 Interpret the correlation. Choose the corect answer below. 190 1.75 175 1.82 CA. As the maximum weight for which one repetition of a half squat can be performed increases, time to run a 10-meter sprint tends to decrease. 155 2.06 O B. Increases in the maximum weight for which one repetition of a half squat can be performed cause time to run a 10-meter sprint to decrease. 190 1.73 O C. Based on the correlation, there do be a linear relationship between the maximum weight for which one repetition of a half squat can be pe 170 1.8 be any relationship between the maximum weight for which one repetition of a half squat can be perform 150 2.09 O D. Based on the correlation, there do 170 2.03 O E. As the maximum weight for which a half squat can be performed increases, time to run a 10-meter sprint tends to increaso. is O F. Increases in the maximum weight etition of a haif squat can be performed cause time to run a 10-meter sprint to increase. is not (d) Use the table of critical values for the I in coefficient to make a conclusion about the correlation coefficient. Let a = 0.01. Print Done sufficient evidence at the 1% level of significance to conclude that V betwe ed The critical value is. Therefore, there and time to run a 10-meter sprint. (Round to three decimal places as needed.)
BROWS the maximum weights (in kilograms) for which one repetition of a half squat can be performed and the times (in seconds) to run a 10-meter sprint for 12 intemational soccer players. Complete parts (a) through (d) below. Click here to view the data table. Click here to view the table of critical values for the Pearson correlation coefficient. Data Table (b) Calculate the sample correlation coefficient r. r= -0.956 (Round to three decimal places as needed.) Maximum weight, x Time, y 175 1.93 (c) Describe the type of correlation, if any, and interpret the correlation in the context of the data. 170 1.91 145 2.16 There is a strong negative linear correlation. 205 1.55 145 2.17 Interpret the correlation. Choose the corect answer below. 190 1.75 175 1.82 CA. As the maximum weight for which one repetition of a half squat can be performed increases, time to run a 10-meter sprint tends to decrease. 155 2.06 O B. Increases in the maximum weight for which one repetition of a half squat can be performed cause time to run a 10-meter sprint to decrease. 190 1.73 O C. Based on the correlation, there do be a linear relationship between the maximum weight for which one repetition of a half squat can be pe 170 1.8 be any relationship between the maximum weight for which one repetition of a half squat can be perform 150 2.09 O D. Based on the correlation, there do 170 2.03 O E. As the maximum weight for which a half squat can be performed increases, time to run a 10-meter sprint tends to increaso. is O F. Increases in the maximum weight etition of a haif squat can be performed cause time to run a 10-meter sprint to increase. is not (d) Use the table of critical values for the I in coefficient to make a conclusion about the correlation coefficient. Let a = 0.01. Print Done sufficient evidence at the 1% level of significance to conclude that V betwe ed The critical value is. Therefore, there and time to run a 10-meter sprint. (Round to three decimal places as needed.)

Glencoe Algebra 1, Student Edition, 9780079039897, 0079039898, 2018
18th Edition
ISBN:9780079039897
Author:Carter
Publisher:Carter
Chapter10: Statistics
Section10.3: Measures Of Spread
Problem 1GP

Related questions
Question
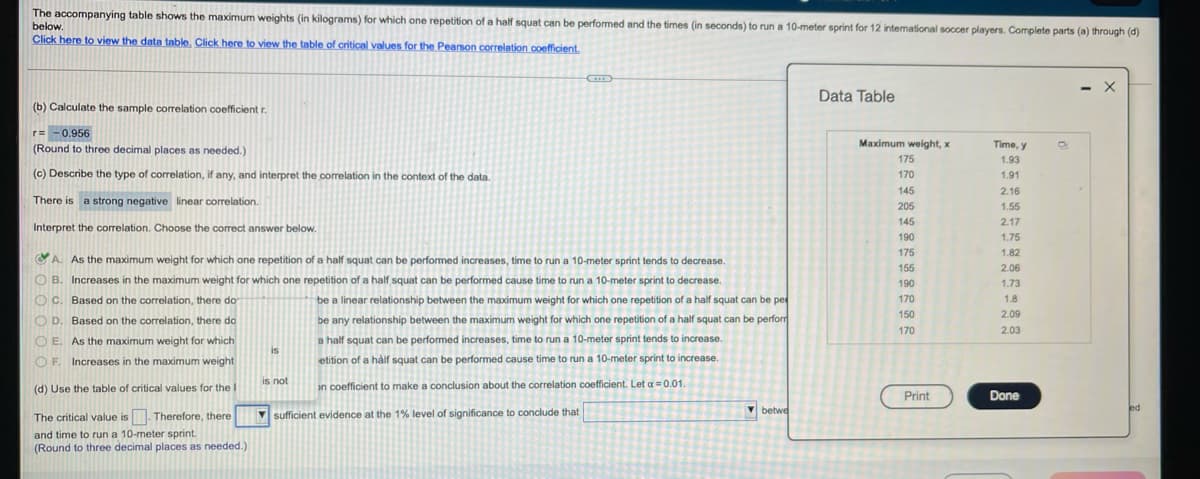
Transcribed Image Text:The accompanying table shows the maximum weights (in kilograms) for which one repetition of a half squat can be performed and the times (in seconds) to run a 10-meter sprint for 12 intemational soccer players. Complete parts (a) through (d)
below.
Click here to view the data table. Click here to view the table of critical values for the Pearson correlation coefficient.
- X
Data Table
(b) Calculate the sample correlation coefficient r.
r= -0.956
(Round to three decimal places as needed.)
Maximum weight, x
Time, y
175
1.93
(c) Describe the type of correlation, if any, and interpret the correlation in the context of the data.
170
1.91
145
2.16
There is a strong negative linear correlation.
205
1.55
145
2.17
Interpret the correlation. Choose the correct answer below.
190
1.75
175
1.82
CA. As the maximum weight for which one repetition of a half squat can be performed increases, time to run a 10-meter sprint tends to decrease.
155
2.06
O B. Increases in the maximum weight for which one repetition of a half squat can be performed cause time to run a 10-meter sprint to decrease.
190
1.73
O C. Based on the correlation, there do
be a linear relationship between the maximum weight for which one repetition of a half squat can be pe
170
1.8
150
2.09
O D. Based on the correlation, there do
be any relationship between the maximum weight for which one repetition of a half squat can be perfor
170
2.03
O E. As the maximum weight for which
a half squat can be performed increases, time to run a 10-meter sprint tends to increase.
is
O F. Increases in the maximum weight
etition of a hàlf squat can be performed cause time to run a 10-meter sprint to increase.
is not
(d) Use the table of critical values for the I
an coefficient to make a conclusion about the correlation coefficient. Let a = 0.01.
Print
Done
The critical value is. Therefore, there
V sufficient evidence at the 1% level of significance to conclude that
V
betwe
ed
and time to run a 10-meter sprint.
(Round to three decimal places as needed.)
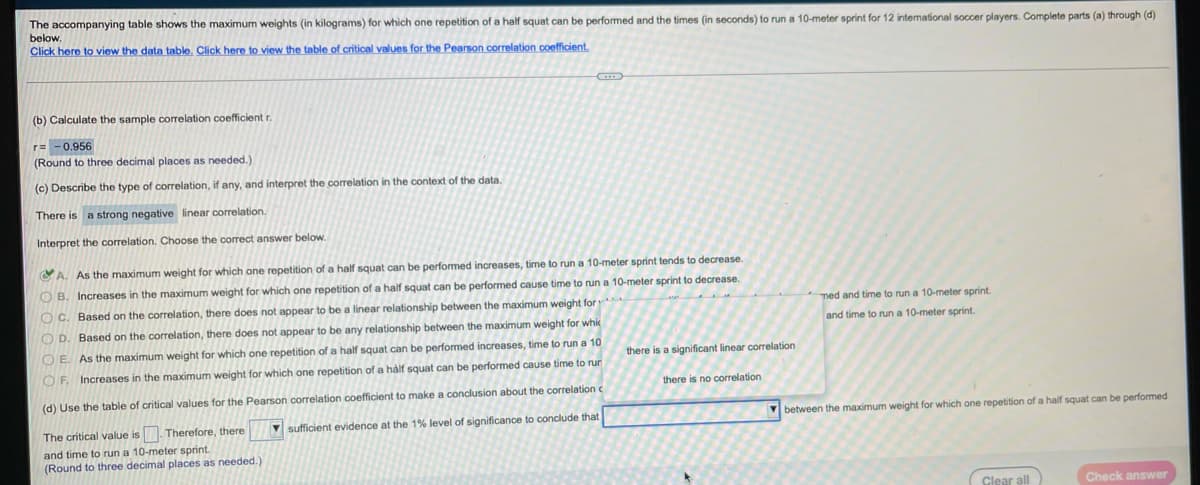
Transcribed Image Text:The accompanying table shows the maximum weights (in kilograms) for which one repetition of a half squat can be performmed and the times (in seconds) to run a 10-meter sprint for 12 intemational soccer players. Complete parts (a) through (d)
below.
Click here
view the data table. Click here to view the table of critical values for the Pearson correlation coefficient.
(b) Calculate the sample corelation coefficient r.
r= -0.956
(Round to three decimal places as needed.)
(c) Describe the type of correlation, if any, and interpret the correlation in the context of the data.
There is a strong negative linear correlation.
Interpret the correlation. Choose the correct answer below.
CA. As the maximum weight for which one repetition of a half squat can be performed increases, time to run a 10-meter sprint tends to decrease.
OB. Increases in the maximum weight for which one repetition of a half squat can be performed cause time to run a 10-meter sprint to decrease.
OC. Based on the correlation, there does not appear to be a linear relationship between the maximum weight for
ned and time to run a 10-meter sprint.
O D. Based on the correlation, there does not appear to be any relationship between the maximum weight for whic
and time
run a 10-meter sprint.
O E As the maximum weight for which one repetition of a half squat can be performed increases, time to run a 10
there is a significant linear correlation
OF. Increases in the maximum weight for which one repetition of a hàlf squat can be performed cause time to rur
there is no correlation
(d) Use the table of critical values for the Pearson correlation coefficient to make a conclusion about the correlation e
V between the maximum weight for which one repetition of a half squat can be performed
The critical value is. Therefore, there
and time to run a 10-meter sprint.
(Round to three decimal places as needed.)
V sufficient evidence at the 1% level of significance to conclude that
Clear all
Check answer
Expert Solution
This question has been solved!
Explore an expertly crafted, step-by-step solution for a thorough understanding of key concepts.

This is a popular solution!

Trending now
This is a popular solution!

Step by step
Solved in 2 steps with 2 images

Recommended textbooks for you
Glencoe Algebra 1, Student Edition, 9780079039897…
Algebra
ISBN:
9780079039897
Author:
Carter
Publisher:
McGraw Hill
Glencoe Algebra 1, Student Edition, 9780079039897…
Algebra
ISBN:
9780079039897
Author:
Carter
Publisher:
McGraw Hill