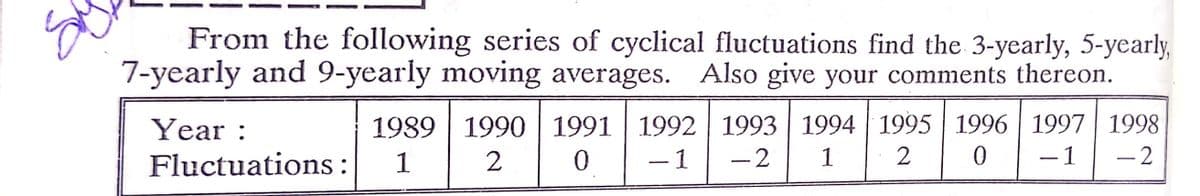
From the following series of cyclical fluctuations find the 3-yearly, 5-yearly, 7-yearly and 9-yearly moving averages. Also give your comments thereon. 1992 1993 1994 1995 1996 1997 1998 Year : Fluctuations: 1989 1990 1991 1 -1 -2 1 - 1 - 2


Q: Ho:p = 0 H3:p # 0 Identify the critical value(s). Select the correct choice below and fill in any…
A: Given that X Y X \cdot YX⋅Y X^2X2 Y^2Y2 0 37 0 0 1369 1 44 44 1 1936 2 50 100 4…
Q: v. Given that Sharon can only procure the list of barangays and nothing else, what is the most apt…
A: Sampling is a process of selecting samples from a population.
Q: Suppose Diane and Jack are each attempting to use a simulation to describe the sampling distribution…
A: For the given data find the required blanks
Q: A sales manager wants to forecast monthly sales for the company's products using the following…
A: Given the monthly sales data of a company as Month Sales 1 3803 2 2558 3 3469 4 3442 5…
Q: In a sample of 1542 fiction novels, the mean number of pages was 374 pages. The population of…
A: Solution Given
Q: You wish to determine if there is a linear correlation between the two variables at a significance…
A: For the given data Find r =? p value =? Final Conclusion ?
Q: gives the population and earnings of two town A and B. Represent the data graphically so as to bring…
A:
Q: A school guidance counselor is concerned that a greater proportion of high school students are…
A: Explanation:Here given the power p value and find the interpretation In this given information.…
Q: As Senior Class President, one of your lifelong duties is overseeing the planning of your high…
A:
Q: a baker calculated the cost of ingredients for a bran muffin at S0.37 and wanted a 40% food…
A: Given : Discount = 5% Cos t of 1 muffin ingredients = 0.37 Profit on food cost = 40%
Q: 1. The date below are to be used to predict y from x. 1 4 Xi 4 3 3 4 yi 16 12 17 13 22 Assume that…
A:
Q: An employment agency wants to see which of three types of ads in the help-wanted section of local…
A:
Q: there are theree measures of central tendency: the mean, the median and the mode. Measures persion…
A: Mean can measure quantitative data Mode and median are best for qualitative and quantitative data
Q: 3. Understanding graphs: A certain company wishes to know the pulse of their employees in the…
A: Given the pie chart graph and we have to answer the indicated problem using the graph.
Q: A sample of 10 employees at a certain company spent a mean of 4.1 hours working from home on the…
A:
Q: A group of veterinary researchers plans a study to estimate the average number of enteroliths in…
A: The random variable number of enteroliths follows normal distribution. We have to find the sample…
Q: A sales manager wants to forecast monthly sales for the company's products using the following…
A: Given information: The data represents the monthly sales data.
Q: (a) The standard normal curve is graphed below. Shade the region under the standard normal curve to…
A: We have to find out z score area for given data... Here we have to use Aleks calculator for finnding…
Q: Illustration 10.17. The following table gives weight in pounds of fat buliocks and fat sheep. Fat…
A:
Q: = 11: X 3 6 10 12 4 9 15 18 7 5 8 Y 9 18 30 36 12…
A: We have given that, X:- 3 6 10 12 4 9 15 18 7 5 8 Y:- 9 18 30 36 12 27 45 54 21 15 24 Then, We will…
Q: Learner Height (in meter) Consider the heights of 5 learners. Suppose you are interested in…
A: Since you have posted a question with multiple subparts, we will solve first 3 sub-parts for you…
Q: HA = 0.321 (Round to three decimal places as needed.) Determine the standard deviation of the…
A: Solution-: Given: N=30000,n=1200,p=0.321 We find, (a) μp^=? (b) σp^=?
Q: Zahra is a company specializing in high-end cosmetics. Its signature nail polish color is Soft…
A: Solution:
Q: The number of pounds of steam used per month by a chemical plant is thought to be related to the…
A: Given The number of pounds of steam used per month by a chemical plant is thought to be related to…
Q: In a recent poll, 70% of the 600 female respondents said they would vote for a woman president,…
A: For the given data a) Construct a 95% confidence interval around the difference in population…
Q: We have data on the lean body mass and resting metabolic rate for 12 women who are subjects in a…
A:
Q: 2. Which of the following is NOT a role of the error term (as covered in the notes)? Select one: а.…
A: An error term ε appears in a statistical regression model to indicate the uncertainty in the model.…
Q: The population of a school has the following approximate student breakdown: 310 grade 9, grade 10,…
A: Given information: The information about multi-stage sampling is given.
Q: Without using software, how would you estimate the number of degrees of freedom for this problem
A: It is given that Sample size for treatment group n1 = 22 Sample size for control group n2 = 24
Q: Question 11: (You don't have to answer this part it is just for reference) Sixty-four semi trucks…
A: The random variable weight of trucks follows normal distribution. We have to construct 90%…
Q: Reading proficiency: An educator wants to construct a 99.8% confidence interval for the proportion…
A:
Q: In the past decades, there have been intensive antismoking campaigns sponsored by both federal and…
A:
Q: A Type I error is: Select one: incorrectly specifying the null hypothesis. accepting the null…
A: Here we have to select the correct option for Type I error
Q: Illustration 10.42. From the data given below about four sub- groups, calculate the average and the…
A:
Q: The following table gives the age distribution of students admitted to a college in the years 1914…
A:
Q: A study was conducted to determine whether the final grade of a student in an introductory…
A: (a) Use EXCEL to obtain the value correlation coefficient r: EXCEL procedure: Go to EXCEL Go…
Q: When can binomial distribution be well approximated by Poisson distribution? What is the…
A: Let there are n trials and each having two outcomes - Success and Failure. The trials are…
Q: A light bulb manufacturer guarantees that the mean life of a certain type of light bulb is at least…
A: Population mean (µ) = 758Population Standard deviations (σ) = 61Sample size (n) = 27Sample mean (x̅)…
Q: Use the formula to find the standard error of the distribution of differences in sample means,…
A:
Q: A 9-year-old girl did a science fair experiment in which she tested professional touch therapists to…
A: Given,n=293x=128sample proportion(p^)=xnsample proportion(p^)=128293=0.4369α=0.05
Q: Here is a bivariate data set. x y 74 50.9 60.7 56.8 75 62.4 81.5 46.6 61.5 45.6 62.9 59.7 71.9 47.9…
A: The independent variable is x. The dependent variable is y. We have to find the correlation…
Q: A study found that the mean amount of time cars spent in drive-throughs of a certain fast-food…
A:
Q: What does an A X B interaction mean in a two - way ANOVA? A. The affect of factor A depends on the…
A: In this case, we need to identify the correct option for the given statement.
Q: ilustration 12. From the following data compute the 3-yearly.and 5-yearly moving averages nd 5 7 8…
A:
Q: Assume that the values x below, represent data collected for a population. Calculate the summary…
A: For the given data mean =? s.d =? variance =?
Q: e. Interpret r² : O 50% of all students will receive the average score on the final exam. O There is…
A: For the given data Find the required blanks
Q: dt 3:56 PM In a random sample of 808 American adults, 505 lived in households with no landline…
A: Given that Sample size (n) = 808 People lived in households with no landline telephone (x) = 505…
Q: Consider the data set of twelve numbers between 1 and 10 {1, 1, 2, 2, 2, 3, 4, 4, 5, 6, 8, 10 }. The…
A:
Q: What is the relationship between the amount of time statistics students study per week and their…
A: Since you have posted a question with multiple sub-parts, we will solve first three sub- parts for…
Q: f. Based on this, we should O fail to reject the null O reject the null accept the null g. Thus, the…
A:

Step by step
Solved in 3 steps with 3 images

- Which of the following time series forecasting methods would not be used to forecast seasonal data?The following ratio-to-moving averages for the seasonally adjusted series were found by the decomposition method applied on a time series representing quarterly sales for January 2018 to December 2020 period: a. Calculate the Seasonal Index for every quarter. b. If the trend is described by the trend line T^ = 1,000 + 30 t, what is the forecast for the fourth quarter of 2021?The table below shows percentage changes (xi) in the Dow-Jones index over the first five trading days of each of thirteen years and also the corresponding percentage changes (yi) in another index. xi yi 1.5 14.9 0.2 -9.2 -0.1 19.6 2.8 20.3 2.2 -3.7 -1.6 27.7 -1.3 22.6 5.6 2.3 -1.4 11.9 1.4 27.0 1.5 -4.3 -4.7 20.3 1.1 4.2 1- Calculate the sample correlation and interpret. 2- Test at the 1% significance level, against a two-sided alternative, the null hypothesis that the population correlation is 0. Thanks.
- Observe the mean, the standard deviation, and the CV of the annual rate of return of the portfolio. Apple Historical Annual Stock Price Data Year Average Stock Price Year Open Year High Year Low Year Close Annual % Change 2021 135.6974 129.4100 156.6900 116.3600 148.7600 12.11% 2020 95.3468 75.0875 136.6900 56.0925 132.6900 80.75% 2019 52.0640 39.4800 73.4125 35.5475 73.4125 86.16% 2018 47.2634 43.0650 58.0175 36.7075 39.4350 -6.79% 2017 37.6378 29.0375 44.1050 29.0050 42.3075 46.11% 2016 26.1510 26.3375 29.5625 22.5850 28.9550 10.03% 2015 30.0096 27.3325 33.2500 25.7800 26.3150 -4.64% 2014 23.0661 19.7546 29.7500 17.8494 27.5950 37.72% 2013 16.8798 19.6082 20.3604 13.9475 20.0364 5.42% 2012 20.5732 14.6868 25.0750 14.6868 19.0062 31.40% 2011 13.0002 11.7704 15.0800 11.2614…The following data set provides the total number of shipments of core major household appliances in the U.S. from 2000 to 2016 (in millions): Year Shipments (millions) 2000 38.4 2001 38.2 2002 40.8 2003 42.5 2004 46.1 2005 47.0 2006 46.7 2007 44.1 2008 39.8 2009 36.5 2010 38.2 2011 36.0 2012 35.8 2013 39.2 2014 41.5 2015 42.9 2016 44.7 a. Plot the time series. b. Fit a three-year moving average to the data and plot the results. c. Fit a five-year moving average to the data and plot the results. d. Compute a linear trend forecasting equation and plot the trend line. e. Compute a quadratic trend forecasting equation and plot the results.Analyse the time series of the following supermarket sales data and present the results in graphical form, including a forecast for the daily sales in week 5. Supermarket sales (K000) for a particular period Week 1 Week 2 Week 3 Week 4 Monday 22 22 24 26 Tuesday 36 34 38 38 Wednesday 40 42 43 45 Thursday 48 49 49 50 Friday 61 58 62 64 Saturday 58 59 58 58
- Using the time series data in the table, respond to the following items. Period Sales 1 $ 615 2 676 3 761 4 710 5 784 6 801 7 852 8 698 9 1,193 10 1,115 11 1,231 12 1,259 13 1,495 14 1,229 15 1,652 16 1,337 17 1,673 18 1,613 Please show work, thanks.The following is a time series for the last 6 months of 2016 50 54 65 58 70 68 The three (3) point moving averages are:Consider the following time series data.
- Consider the following time series data: 1 2 3 4 5 6 7 26 15 22 14 21 25 17 PART 1.Compute MSE using the most recent value as the forecast for the next period and then calculate the forecast for month 8. PART 2.Compute MSE using the average of all the data available as the forecast for the next period. What is the forecast for month 8?The table below contains the average price paid for a new home in a certain area from 2000 to 2010. a. Construct a time-series plot of new home prices. b. What pattern, if any, is present in the data? Year Average_Price_($_thousands)2000 351.12001 330.52002 310.52003 296.72004 229.72005 182.32006 154.52007 156.32008 154.72009 154.52010 154.5An asset has a depreciable basis of $13,200 and qualifies as 3-year MACRS property. The MACRS percentages are: 16.67, 33.33, 33.33. and 16.67 percent for years 1 to 4, respectively. What is the year 3 ending book value?