b)Use this table to find the area under the standard normal curve to the left of z=−0.50 Give your answer to four decimal places (for example, 0.1234).
b)Use this table to find the area under the standard normal curve to the left of z=−0.50 Give your answer to four decimal places (for example, 0.1234).

Chapter1: Making Economics Decisions
Section: Chapter Questions
Problem 1QTC

Related questions
Question
part 2 of (
b)Use this table to find the area under the standard normal curve to the left of z=−0.50
Give your answer to four decimal places (for example, 0.1234).
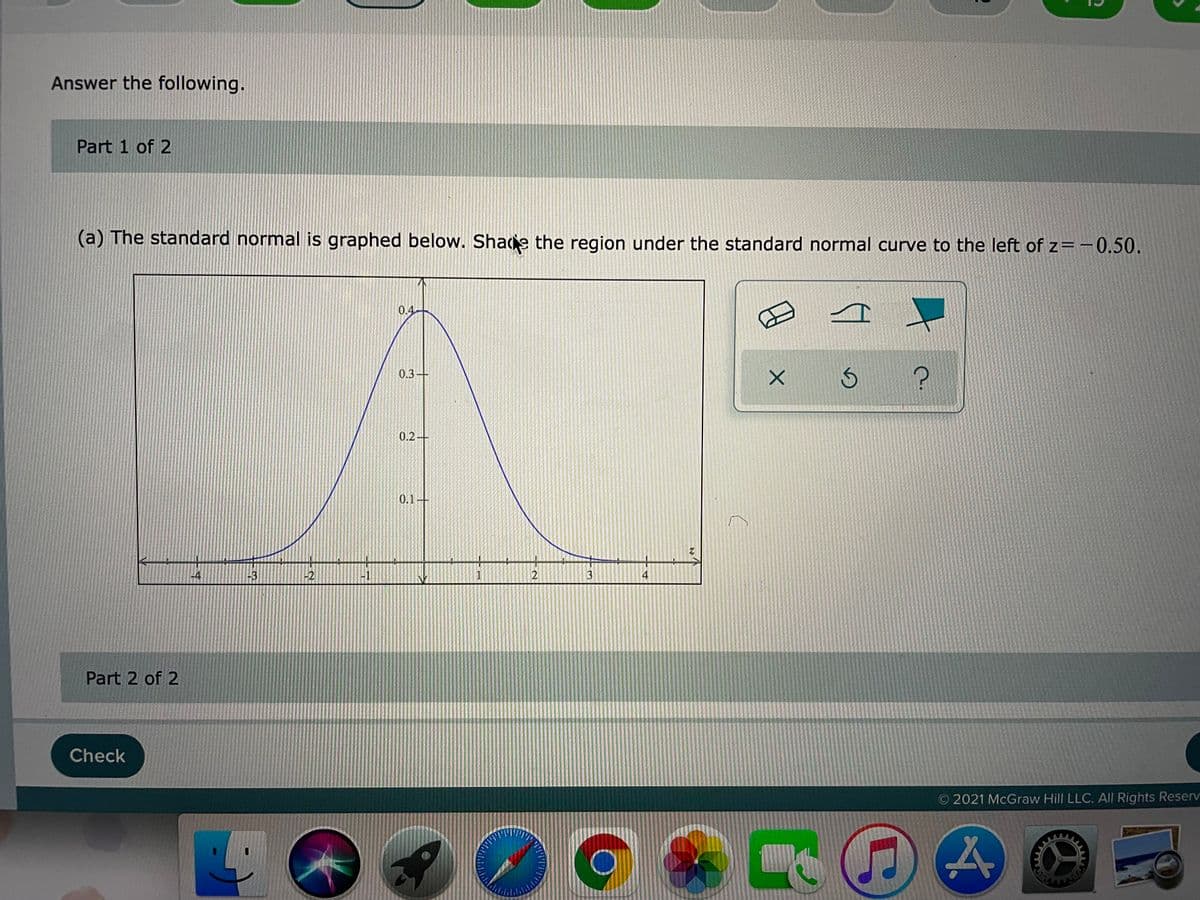
Transcribed Image Text:Answer the following.
Part 1 of 2
(a) The standard normal is graphed below. Shade the region under the standard normal curve to the left of z=-0.50.
0.4-
0.3-
0.2
0.1+
-4
-3
-2
-1
1
3
4
Part 2 of 2
Check
O 2021 McGraw Hill LLC. All Rights Reserv
Expert Solution
This question has been solved!
Explore an expertly crafted, step-by-step solution for a thorough understanding of key concepts.

Step by step
Solved in 2 steps

Recommended textbooks for you

Principles of Economics (12th Edition)
Economics
ISBN:
9780134078779
Author:
Karl E. Case, Ray C. Fair, Sharon E. Oster
Publisher:
PEARSON

Engineering Economy (17th Edition)
Economics
ISBN:
9780134870069
Author:
William G. Sullivan, Elin M. Wicks, C. Patrick Koelling
Publisher:
PEARSON
Principles of Economics (12th Edition)
Economics
ISBN:
9780134078779
Author:
Karl E. Case, Ray C. Fair, Sharon E. Oster
Publisher:
PEARSON
Engineering Economy (17th Edition)
Economics
ISBN:
9780134870069
Author:
William G. Sullivan, Elin M. Wicks, C. Patrick Koelling
Publisher:
PEARSON

Principles of Economics (MindTap Course List)
Economics
ISBN:
9781305585126
Author:
N. Gregory Mankiw
Publisher:
Cengage Learning

Managerial Economics: A Problem Solving Approach
Economics
ISBN:
9781337106665
Author:
Luke M. Froeb, Brian T. McCann, Michael R. Ward, Mike Shor
Publisher:
Cengage Learning

Managerial Economics & Business Strategy (Mcgraw-…
Economics
ISBN:
9781259290619
Author:
Michael Baye, Jeff Prince
Publisher:
McGraw-Hill Education