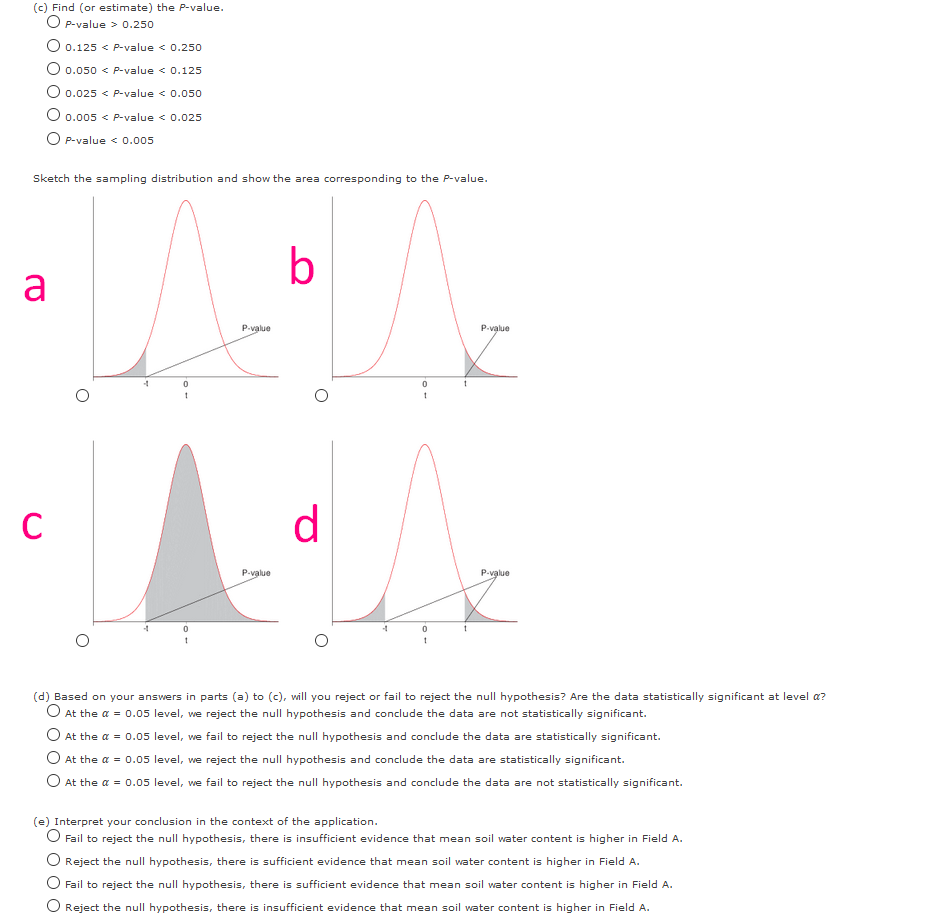
(c) Find (or estimate) the Pvalue. O P-value > 0.250 O 0.125 < P-value < 0.250 O 0.050 < P-value < 0.125 O 0.025 < P-value < 0.050 O 0.005 < P-value < 0.025 O P-value < 0.005 Sketch the sampling distribution and show the area corresponding to the P-value. a Puglue Pvalue d. Pvalue P-value (d) Based on your answers in parts (a) to (c), will you reject or fail to reject the null hypothesis? Are the data statistically significant at level a? O At the a = 0.05 level, we reject the null hypothesis and conclude the data are not statistically significant. O At the a = 0.05 level, we fail to reject the null hypothesis and conclude the data are statistically significant. O At the a = 0.05 level, vwe reject the null hypothesis and conclude the data are statistically significant. O At the a = 0.05 level, we fail to reject the null hypothesis and conclude the data are not statistically significant. (e) Interpret your conclusion in the context of the application. O Fail to reject the null hypothesis, there is insufficient evidence that mean soil water content is higher in Field A. O Reject the null hypothesis, there is sufficient evidence that mean soil water content is higher in Field A. O Fail to reject the null hypothesis, there is sufficient evidence that mean soil water content is higher in Field A. O Reject the null hypothesis, there is insufficient evidence that mean soil water content is higher in Field A.

Linear Algebra: A Modern Introduction
4th Edition
ISBN:9781285463247
Author:David Poole
Publisher:David Poole
Chapter4: Eigenvalues And Eigenvectors
Section4.6: Applications And The Perron-frobenius Theorem
Problem 22EQ
icon
Related questions
icon
Concept explainers
Topic Video
Question

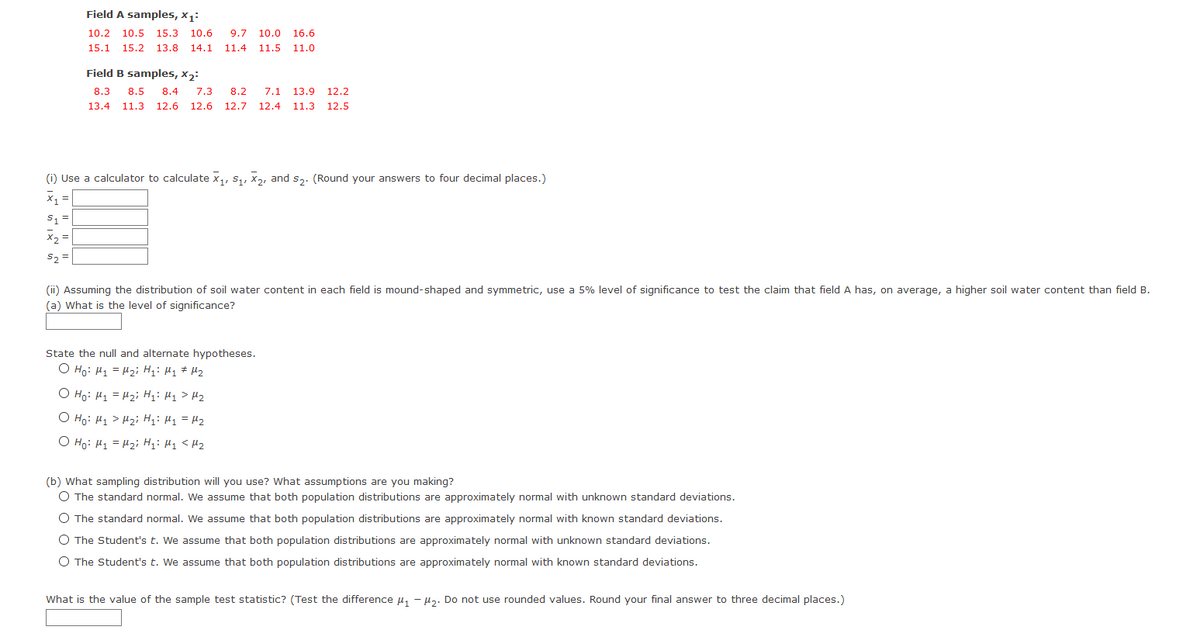
The pathogen Phytophthora capsici causes bell peppers to wilt and die. Because bell peppers are an important commercial crop, this disease has undergone a great deal of agricultural research. It is thought that too much water aids the spread of the pathogen. Two fields are under study. The first step in the research project is to compare the mean soil water content for the two fields. Units are percent water by volume of soil.

I need help with sketching (c) (d) and (e)

(c) Find (or estimate) the P-value.
O P-value > 0.250
O 0.125 < P-value < 0.250
0.050 < P-value < 0.125
O 0.025 < P-value < 0.050
O 0.005 < P-value < 0.025
O P-value < 0.005
Sketch the sampling distribution and show the area corresponding to the P-value.
a
P-value
P.value
d.
P-value
P-value
(d) Based on your answers in parts (a) to (c), vill you reject or fail to reject the null hypothesis? Are the data statistically significant at level a?
O At the a = 0.05 level, we reject the null hypothesis and conclude the data are not statistically significant.
At the a = 0.05 level, we fail to reject the null hypothesis and conclude the data are statistically significant.
O At the a = 0.05 level, we reject the null hypothesis and conclude the data are statistically significant.
O At the a = 0.05 level, we fail to reject the null hypothesis and conclude the data are not statistically significant.
(e) Interpret your conclusion in the context of the application.
O Fail to reject the null hypothesis, there is insufficient evidence that mean soil vater content is higher in Field A.
Reject the null hypothesis, there is sufficient evidence that mean soil water content is higher in Field A.
O Fail to reject the null hypothesis, there is sufficient evidence that mean soil water content is higher in Field A.
O Reject the null hypothesis, there is insufficient evidence that mean soil water content is higher in Field A.
Transcribed Image Text:(c) Find (or estimate) the P-value. O P-value > 0.250 O 0.125 < P-value < 0.250 0.050 < P-value < 0.125 O 0.025 < P-value < 0.050 O 0.005 < P-value < 0.025 O P-value < 0.005 Sketch the sampling distribution and show the area corresponding to the P-value. a P-value P.value d. P-value P-value (d) Based on your answers in parts (a) to (c), vill you reject or fail to reject the null hypothesis? Are the data statistically significant at level a? O At the a = 0.05 level, we reject the null hypothesis and conclude the data are not statistically significant. At the a = 0.05 level, we fail to reject the null hypothesis and conclude the data are statistically significant. O At the a = 0.05 level, we reject the null hypothesis and conclude the data are statistically significant. O At the a = 0.05 level, we fail to reject the null hypothesis and conclude the data are not statistically significant. (e) Interpret your conclusion in the context of the application. O Fail to reject the null hypothesis, there is insufficient evidence that mean soil vater content is higher in Field A. Reject the null hypothesis, there is sufficient evidence that mean soil water content is higher in Field A. O Fail to reject the null hypothesis, there is sufficient evidence that mean soil water content is higher in Field A. O Reject the null hypothesis, there is insufficient evidence that mean soil water content is higher in Field A.
Field A samples, x1:
10.2
10.5 15.3
10.6
9.7
10.0 16.6
15.1
15.2
13.8
14.1
11.4
11.5 11.0
Field B samples, x2:
8.3
8.5
8.4
7.3
8.2
7.1 13.9
12.2
13.4
11.3 12.6
12.6 12.7
12.4 11.3
12.5
(i) Use a calculator to calculate x,, s,, x2, and s,. (Round your answers to four decimal places.)
X2 =
s2 =
(ii) Assuming the distribution of soil water content in each field is mound-shaped and symmetric, use a 5% level of significance to test the claim that field A has, on average, a higher soil water content than field B.
(a) What is the level of significance?
State the null and alternate hypotheses.
O Ho: H1 = H2i H;: H1 # Hz
O Ho: H1 = H2i H;: Hy> Hz
O Ho: H1 > H2i Hi: Hy = H2
O Ho: H1 = H2i Hạ: H1 < H2
(b) What sampling distribution will you use? What assumptions are you making?
O The standard normal. We assume that both population distributions are approximately normal with unknown standard deviations.
O The standard normal. We assume that both population distributions are approximately normal with known standard deviations.
O The Student's t. We assume that both population distributions are approximately normal with unknown standard deviations.
O The Student's t. We assume that both population distributions are approximately normal with known standard deviations.
What is the value of the sample test statistic? (Test the difference µ, - µz. Do not use rounded values. Round your final answer to three decimal places.)
I| ||
Transcribed Image Text:Field A samples, x1: 10.2 10.5 15.3 10.6 9.7 10.0 16.6 15.1 15.2 13.8 14.1 11.4 11.5 11.0 Field B samples, x2: 8.3 8.5 8.4 7.3 8.2 7.1 13.9 12.2 13.4 11.3 12.6 12.6 12.7 12.4 11.3 12.5 (i) Use a calculator to calculate x,, s,, x2, and s,. (Round your answers to four decimal places.) X2 = s2 = (ii) Assuming the distribution of soil water content in each field is mound-shaped and symmetric, use a 5% level of significance to test the claim that field A has, on average, a higher soil water content than field B. (a) What is the level of significance? State the null and alternate hypotheses. O Ho: H1 = H2i H;: H1 # Hz O Ho: H1 = H2i H;: Hy> Hz O Ho: H1 > H2i Hi: Hy = H2 O Ho: H1 = H2i Hạ: H1 < H2 (b) What sampling distribution will you use? What assumptions are you making? O The standard normal. We assume that both population distributions are approximately normal with unknown standard deviations. O The standard normal. We assume that both population distributions are approximately normal with known standard deviations. O The Student's t. We assume that both population distributions are approximately normal with unknown standard deviations. O The Student's t. We assume that both population distributions are approximately normal with known standard deviations. What is the value of the sample test statistic? (Test the difference µ, - µz. Do not use rounded values. Round your final answer to three decimal places.) I| ||
Expert Solution
steps

Step by step

Solved in 2 steps with 12 images

Blurred answer
Knowledge Booster
Angles, Arcs, and Chords and Tangents
Learn more about
Need a deep-dive on the concept behind this application? Look no further. Learn more about this topic, statistics and related others by exploring similar questions and additional content below.
Recommended textbooks for you
Linear Algebra: A Modern Introduction
Algebra
ISBN:
9781285463247
Author:
David Poole
Publisher:
Cengage Learning
Algebra & Trigonometry with Analytic Geometry
Algebra
ISBN:
9781133382119
Author:
Swokowski
Publisher:
Cengage
Glencoe Algebra 1, Student Edition, 9780079039897…
Algebra
ISBN:
9780079039897
Author:
Carter
Publisher:
McGraw Hill