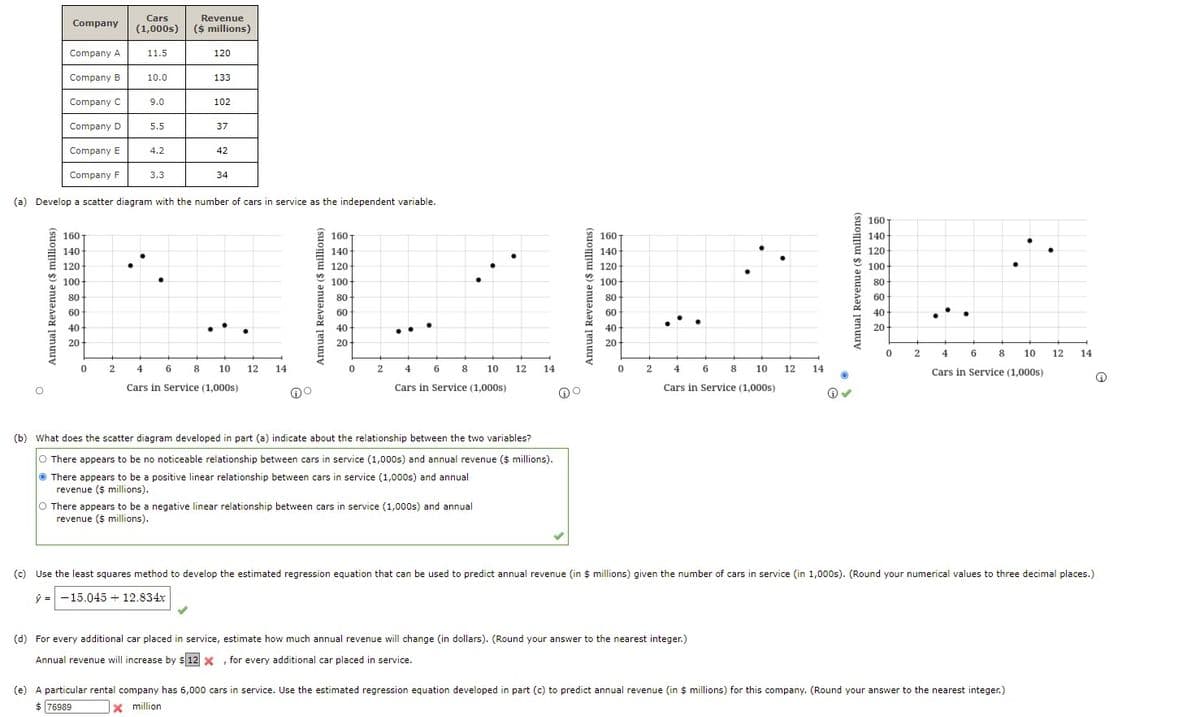
(c) Use the least squares method to develop the estimated regression equation that can be used to predict annual revenue (in $ millions) given the number of cars in service (in 1,000s). (Round your numerical values to three decimal places.) ý = -15.045 + 12.834x (d) For every additional car placed in service, estimate how much annual revenue will change (in dollars). (Round your answer to the nearest integer.) Annual revenue will increase by $12 x ,for every additional car placed in service. (e) A particular rental company has 6,000 cars in service. Use the estimated regression equation developed in part (c) to predict annual revenue (in $ millions) for this company. (Round your answer to the nearest integer.)


Correlation
Correlation defines a relationship between two independent variables. It tells the degree to which variables move in relation to each other. When two sets of data are related to each other, there is a correlation between them.
Linear Correlation
A correlation is used to determine the relationships between numerical and categorical variables. In other words, it is an indicator of how things are connected to one another. The correlation analysis is the study of how variables are related.
Regression Analysis
Regression analysis is a statistical method in which it estimates the relationship between a dependent variable and one or more independent variable. In simple terms dependent variable is called as outcome variable and independent variable is called as predictors. Regression analysis is one of the methods to find the trends in data. The independent variable used in Regression analysis is named Predictor variable. It offers data of an associated dependent variable regarding a particular outcome.


Trending now
This is a popular solution!

Step by step
Solved in 2 steps


