c. At the 0.05 significance level, can we conclude there is a significant positive correlation? places.) Ho:psO H:p>0
c. At the 0.05 significance level, can we conclude there is a significant positive correlation? places.) Ho:psO H:p>0

Glencoe Algebra 1, Student Edition, 9780079039897, 0079039898, 2018
18th Edition
ISBN:9780079039897
Author:Carter
Publisher:Carter
Chapter10: Statistics
Section10.6: Summarizing Categorical Data
Problem 27PPS

Related questions
Question
I need help with C
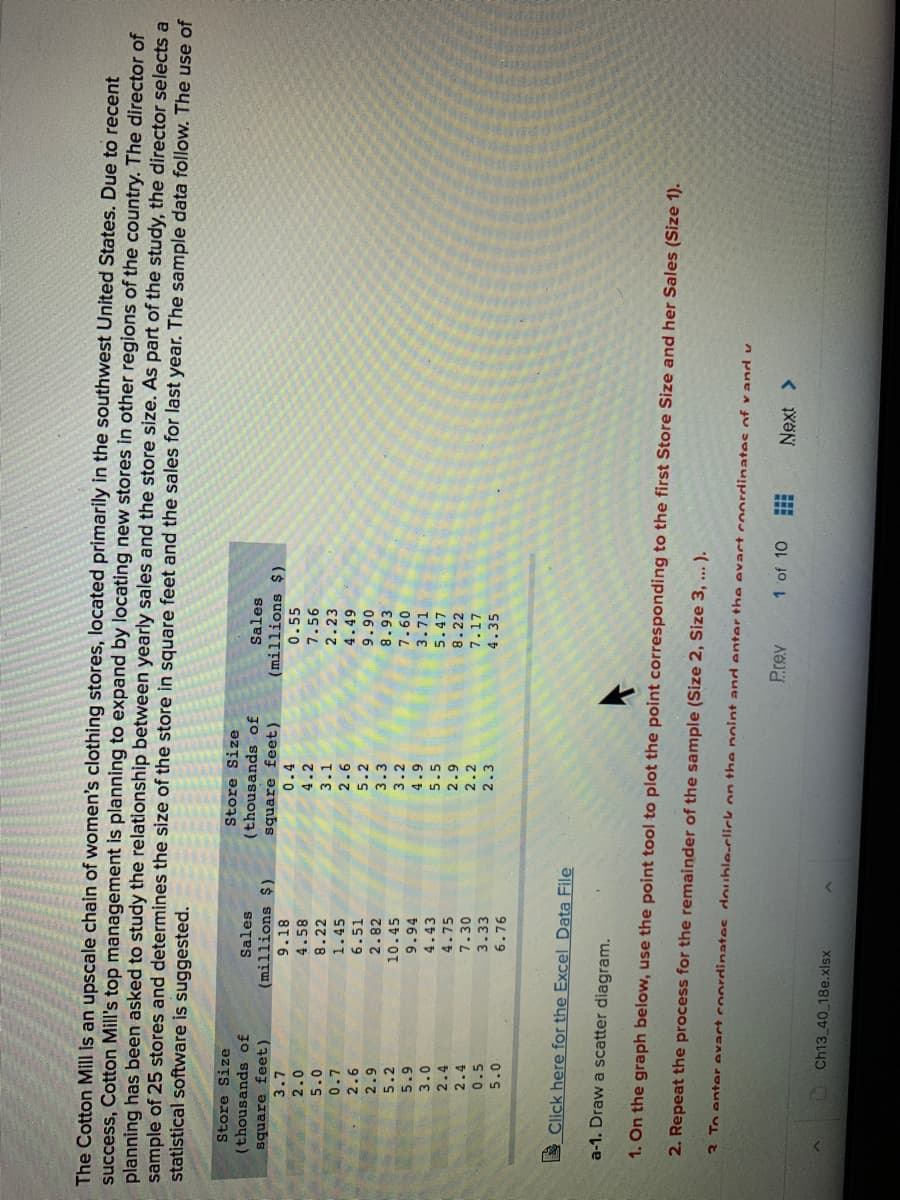
Transcribed Image Text:The Cotton Mill is an upscale chain of women's clothing stores, located primarily in the southwest United States. Due to recent
success, Cotton Mill's top management is planning to expand by locating new stores in other regions of the country. The director of
planning has been asked to study the relationship between yearly sales and the store size. As part of the study, the director selects a
sample of 25 stores and determines the size of the store in square feet and the sales for last year. The sample data follow. The use of
statistical software is suggested.
Store Size
Store Size
(thousands of
Sales
(thousands of
square feet)
Sales
square feet)
3.7
(millions $).
(millions $)
9.18
0.55
2.0
4.58
8.22
4.2
7.56
5.0
0.7
3.1
2.23
1.45
6.51
2.6
4.49
2.6
5.2
3.3
3.2
2.9
06 6
2.82
8.93
5.2
10.45
6'S
3.0
09 L
3.71
9.94
4.43
5.5
5.47
2.4
4.75
8.22
2.4
7.30
2.2
7.17
0.5
3.33
2.3
4.35
6.76
I Click here for the Excel Data File
a-1. Draw a scatter diagram.
1. On the graph below, use the point tool to plot the point corresponding to the first Store Size and her Sales (Size 1).
2. Repeat the process for the remainder of the sample (Size 2, Size 3, ... ).
3 To enter evact coordinates double-click on the noint and enter the evact coordinates of vand v
Prev
1 of 10
Next >
Ch13_40 18e.xlsx
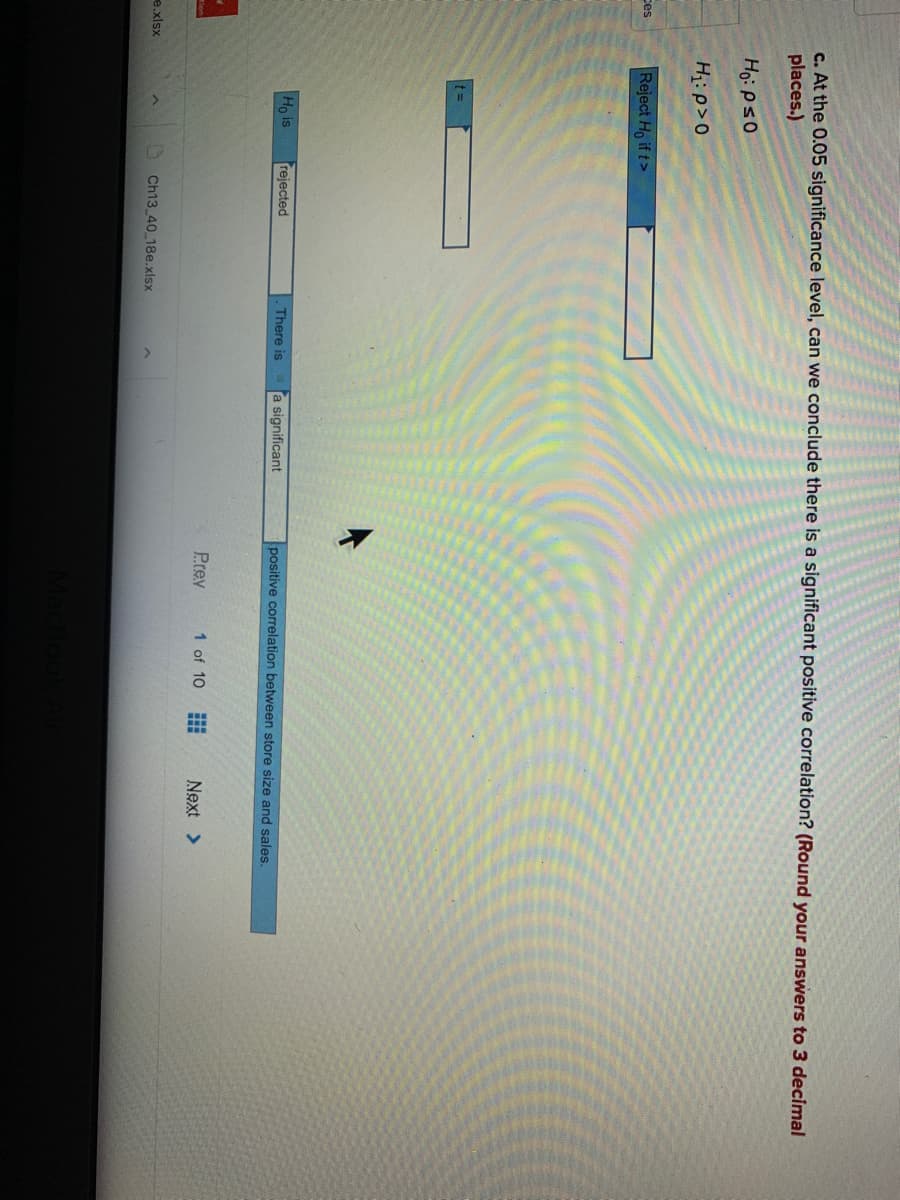
Transcribed Image Text:c. At the 0.05 significance level, can we conclude there is a significant positive correlation? (Round your answers to 3 decimal
places.)
H: p>0
Reject Ho if t>
Ces
%3D
Ho is
rejected
There is
a significant
positive correlation between store size and sales.
Prey
1 of 10
Next >
e.xlsx
Ch13 40 18e.xlsx
Expert Solution
Step 1
Correlation:
Software procedure for correlation in EXCEL.
- Enter the given data in EXCEL sheet.
- Go to Data > Data Analysis > Correlation.
- Select store size and sales column as input ranges
- Select Labels check box.
- Click OK
The output is given below:
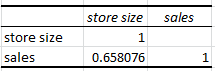
Correlation coefficient r=0.6581.

Step by step
Solved in 2 steps with 1 images

Knowledge Booster


Learn more about
Need a deep-dive on the concept behind this application? Look no further. Learn more about this topic, statistics and related others by exploring similar questions and additional content below.Recommended textbooks for you
Glencoe Algebra 1, Student Edition, 9780079039897…
Algebra
ISBN:
9780079039897
Author:
Carter
Publisher:
McGraw Hill

Big Ideas Math A Bridge To Success Algebra 1: Stu…
Algebra
ISBN:
9781680331141
Author:
HOUGHTON MIFFLIN HARCOURT
Publisher:
Houghton Mifflin Harcourt
Glencoe Algebra 1, Student Edition, 9780079039897…
Algebra
ISBN:
9780079039897
Author:
Carter
Publisher:
McGraw Hill
Big Ideas Math A Bridge To Success Algebra 1: Stu…
Algebra
ISBN:
9781680331141
Author:
HOUGHTON MIFFLIN HARCOURT
Publisher:
Houghton Mifflin Harcourt