c. Dotormine the conditional distribution of college within each gender and the marginal distribution of college. M. Total BUS ENG LIB Total (Type an integer or a decimal rounded to three decimal places as needed.)
c. Dotormine the conditional distribution of college within each gender and the marginal distribution of college. M. Total BUS ENG LIB Total (Type an integer or a decimal rounded to three decimal places as needed.)

Glencoe Algebra 1, Student Edition, 9780079039897, 0079039898, 2018
18th Edition
ISBN:9780079039897
Author:Carter
Publisher:Carter
Chapter10: Statistics
Section10.6: Summarizing Categorical Data
Problem 13CYU

Related questions
Question
7
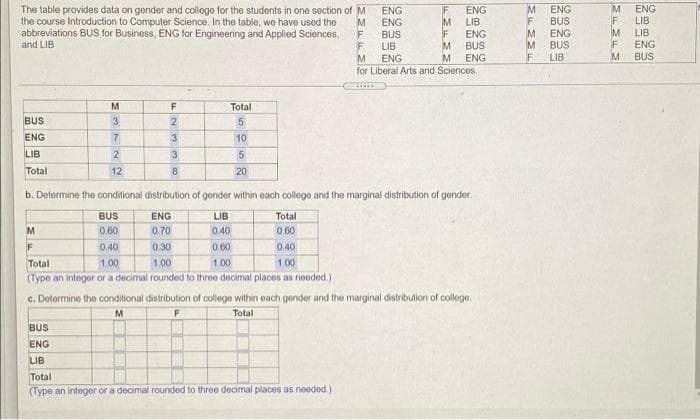
Transcribed Image Text:The table provides data on gender and college for the students in one section of M
the course Introduction to Computer Science. In the tabie, we have used the
abbreviations BUS for Business, ENG for Engineering and Applied Sciences,
and LIB
ENG
BUS
ENG
BUS
LIB
ENG
F LIB
LIB
ENG
ENG
ENG
M
M
LIB
F
M
ENG
ENG
BUS
LIB
ENG
for Liberal Arts and Sciences.
M
BUS
M.
ENG
M.
BUS
M
Total
BUS
3
2
ENG
3.
10
LIB
2
3
5
Total
12
8.
20
b. Determine the conditional distribution of gender within each college and the marginal distribution of gender.
BUS
ENG
LIB
Total
0.60
0.70
0.40
0.60
F
0.40
0.30
0.60
0.40
Total
1.00
1.00
1.00
1.00
(Type an integer or a decimal rounded to three decimal places as neoded.)
c. Dotormine the conditional distribution of college within each gender and the marginal distribution of college.
M.
F
Total
BUS
ENG
LIB
Total
(Type an integer or a decimal rounded to three docimal places as needed.)
Expert Solution
This question has been solved!
Explore an expertly crafted, step-by-step solution for a thorough understanding of key concepts.

Step by step
Solved in 2 steps

Recommended textbooks for you
Glencoe Algebra 1, Student Edition, 9780079039897…
Algebra
ISBN:
9780079039897
Author:
Carter
Publisher:
McGraw Hill


Holt Mcdougal Larson Pre-algebra: Student Edition…
Algebra
ISBN:
9780547587776
Author:
HOLT MCDOUGAL
Publisher:
HOLT MCDOUGAL
Glencoe Algebra 1, Student Edition, 9780079039897…
Algebra
ISBN:
9780079039897
Author:
Carter
Publisher:
McGraw Hill
Holt Mcdougal Larson Pre-algebra: Student Edition…
Algebra
ISBN:
9780547587776
Author:
HOLT MCDOUGAL
Publisher:
HOLT MCDOUGAL