The distribution of majors at the college is shown in the second column of the table below. Fill in the expected frequencies. (Round to the nearest whole number). Frequencies of Majors at the College Expected Percent Outcome Expected Frequency Math/Science 18 Arts & Humanities 29 Business & Economics 25 Other 28
The distribution of majors at the college is shown in the second column of the table below. Fill in the expected frequencies. (Round to the nearest whole number). Frequencies of Majors at the College Expected Percent Outcome Expected Frequency Math/Science 18 Arts & Humanities 29 Business & Economics 25 Other 28

Holt Mcdougal Larson Pre-algebra: Student Edition 2012
1st Edition
ISBN:9780547587776
Author:HOLT MCDOUGAL
Publisher:HOLT MCDOUGAL
Chapter11: Data Analysis And Probability
Section11.4: Collecting Data
Problem 6E

Related questions

Question
100%
Transcribed Image Text:Arts & Humanities
Business & Econormics 153
Other
190
201
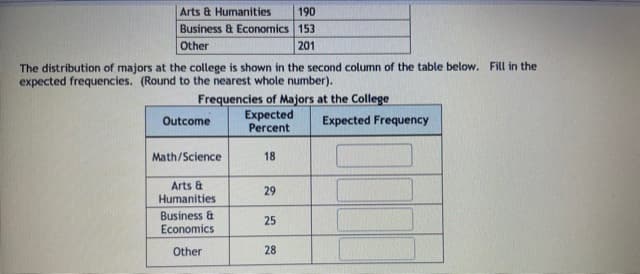
The distribution of majors at the college is shown in the second column of the table below. FiLl in the
expected frequencies. (Round to the nearest whole number).
Frequencies of Majors at the College
Expected
Percent
Outcome
Expected Frequency
Math/Science
18
Arts &
Humanities
29
Business &
Economics
25
Other
28
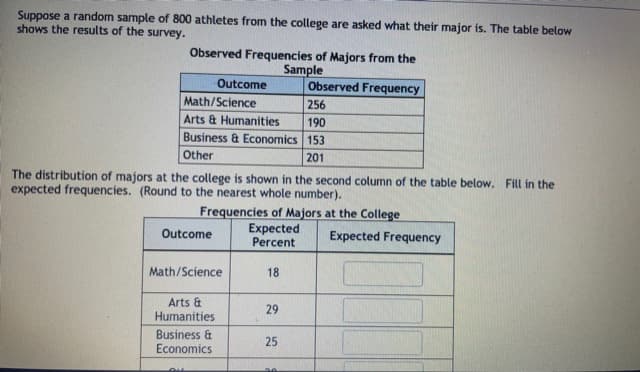
Transcribed Image Text:Suppose a random sample of 800 athletes from the college are asked what their major is. The table below
shows the results of the survey.
Observed Frequencies of Majors from the
Sample
Observed Frequency
Outcome
Math/Science
256
Arts & Humanities
190
Business & Economics 153
Other
201
The distribution of majors at the college is shown in the second column of the table below. Fill in the
expected frequencies. (Round to the nearest whole number).
Frequencies of Majors at the College
Expected
Percent
Outcome
Expected Frequency
Math/Science
18
Arts &
Humanities
29
Business &
Economics
25
Expert Solution
This question has been solved!
Explore an expertly crafted, step-by-step solution for a thorough understanding of key concepts.

This is a popular solution!

Trending now
This is a popular solution!

Step by step
Solved in 2 steps

Knowledge Booster


Learn more about
Need a deep-dive on the concept behind this application? Look no further. Learn more about this topic, statistics and related others by exploring similar questions and additional content below.Recommended textbooks for you
Holt Mcdougal Larson Pre-algebra: Student Edition…
Algebra
ISBN:
9780547587776
Author:
HOLT MCDOUGAL
Publisher:
HOLT MCDOUGAL

Glencoe Algebra 1, Student Edition, 9780079039897…
Algebra
ISBN:
9780079039897
Author:
Carter
Publisher:
McGraw Hill

College Algebra (MindTap Course List)
Algebra
ISBN:
9781305652231
Author:
R. David Gustafson, Jeff Hughes
Publisher:
Cengage Learning
Holt Mcdougal Larson Pre-algebra: Student Edition…
Algebra
ISBN:
9780547587776
Author:
HOLT MCDOUGAL
Publisher:
HOLT MCDOUGAL
Glencoe Algebra 1, Student Edition, 9780079039897…
Algebra
ISBN:
9780079039897
Author:
Carter
Publisher:
McGraw Hill
College Algebra (MindTap Course List)
Algebra
ISBN:
9781305652231
Author:
R. David Gustafson, Jeff Hughes
Publisher:
Cengage Learning