c. Organize the data into a relative frequency table. Use the following intervals: 119.5 - 124.5, 124.5 - 129.5 eto. 119.52124.5 124.52129.5 129.52 134.5 13452139.5 139.93< K4.5 144.5 4149.5 149.5L154.5 reea 23 Draw a relative frequency histogram for the above table, properly labeled.
c. Organize the data into a relative frequency table. Use the following intervals: 119.5 - 124.5, 124.5 - 129.5 eto. 119.52124.5 124.52129.5 129.52 134.5 13452139.5 139.93< K4.5 144.5 4149.5 149.5L154.5 reea 23 Draw a relative frequency histogram for the above table, properly labeled.

Holt Mcdougal Larson Pre-algebra: Student Edition 2012
1st Edition
ISBN:9780547587776
Author:HOLT MCDOUGAL
Publisher:HOLT MCDOUGAL
Chapter11: Data Analysis And Probability
Section11.1: Stem-and-leaf Plots And Histograms
Problem 10E

Related questions
Question
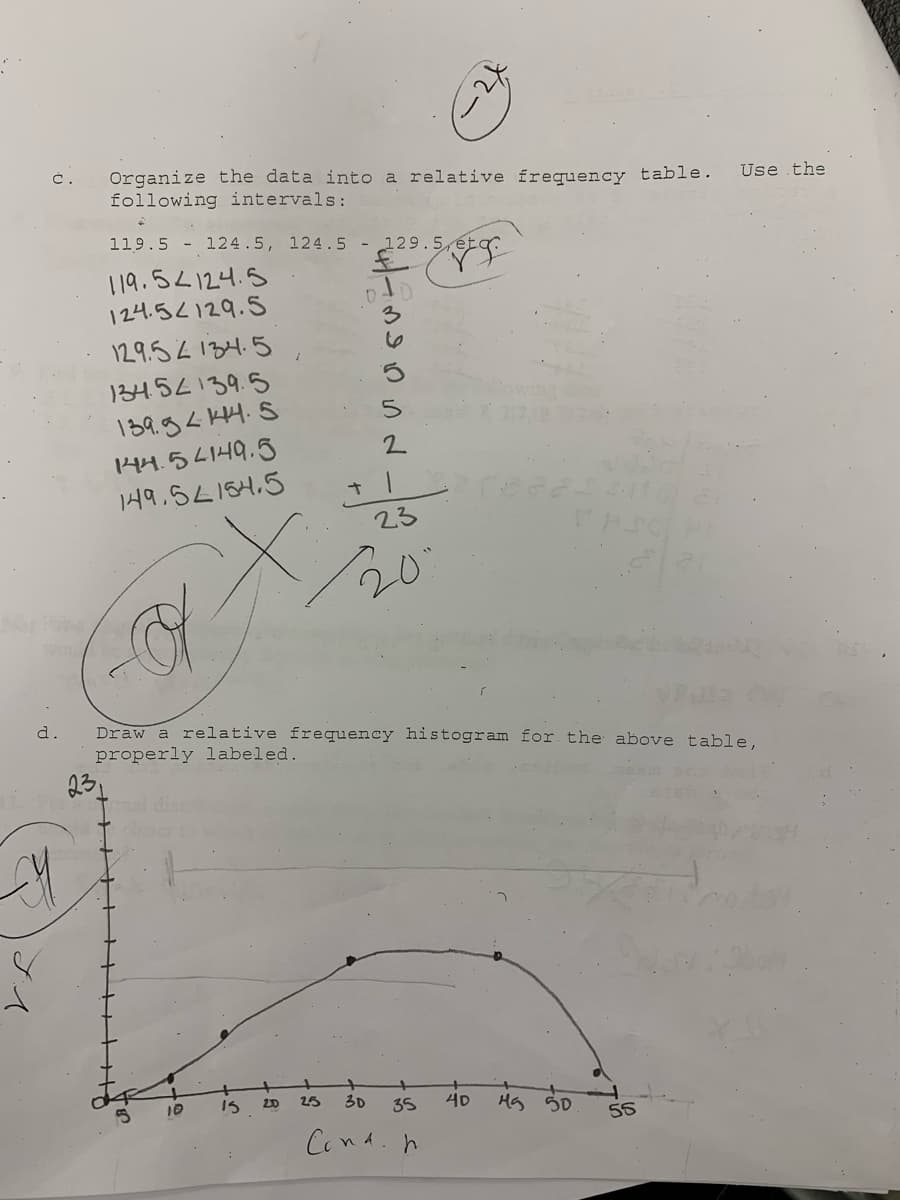
Transcribed Image Text:Organize the data into a relative frequency table.
following intervals:
Č.
Use the
119.5 - 124.5, 124.5- 129.5 et
119.52124.5
124.52129.5
129.52134.5
134.52139.5
139.9< KH.S
144.5 4149.5
149,5L184.5
23
20
Draw a relative frequency histogram for the above table,
properly labeled.
d.
231
10
20
25
30
35
4D
55
Cond. h
Expert Solution
This question has been solved!
Explore an expertly crafted, step-by-step solution for a thorough understanding of key concepts.

This is a popular solution!

Trending now
This is a popular solution!

Step by step
Solved in 2 steps with 1 images

Recommended textbooks for you
Holt Mcdougal Larson Pre-algebra: Student Edition…
Algebra
ISBN:
9780547587776
Author:
HOLT MCDOUGAL
Publisher:
HOLT MCDOUGAL

Glencoe Algebra 1, Student Edition, 9780079039897…
Algebra
ISBN:
9780079039897
Author:
Carter
Publisher:
McGraw Hill
Holt Mcdougal Larson Pre-algebra: Student Edition…
Algebra
ISBN:
9780547587776
Author:
HOLT MCDOUGAL
Publisher:
HOLT MCDOUGAL
Glencoe Algebra 1, Student Edition, 9780079039897…
Algebra
ISBN:
9780079039897
Author:
Carter
Publisher:
McGraw Hill