A random sample of 30 male college students was selected, and their heights were measured. The heights (in inches) are given below. 72 67 68 68 73 70 70 70 73 66 72 67 73 67 73 70 66 70 68 71 69 70 70 67 72 73 66 67 73 73 (a) Complete the frequency distribution for the data. Make sure to enter your answers for the relative frequency as decimals, rounded to the nearest tenth. Height Frequency Relative Frequency 66 67 68 69 70 71 72 73 74
A random sample of 30 male college students was selected, and their heights were measured. The heights (in inches) are given below. 72 67 68 68 73 70 70 70 73 66 72 67 73 67 73 70 66 70 68 71 69 70 70 67 72 73 66 67 73 73 (a) Complete the frequency distribution for the data. Make sure to enter your answers for the relative frequency as decimals, rounded to the nearest tenth. Height Frequency Relative Frequency 66 67 68 69 70 71 72 73 74

Glencoe Algebra 1, Student Edition, 9780079039897, 0079039898, 2018
18th Edition
ISBN:9780079039897
Author:Carter
Publisher:Carter
Chapter10: Statistics
Section10.5: Comparing Sets Of Data
Problem 14PPS

Related questions
Question
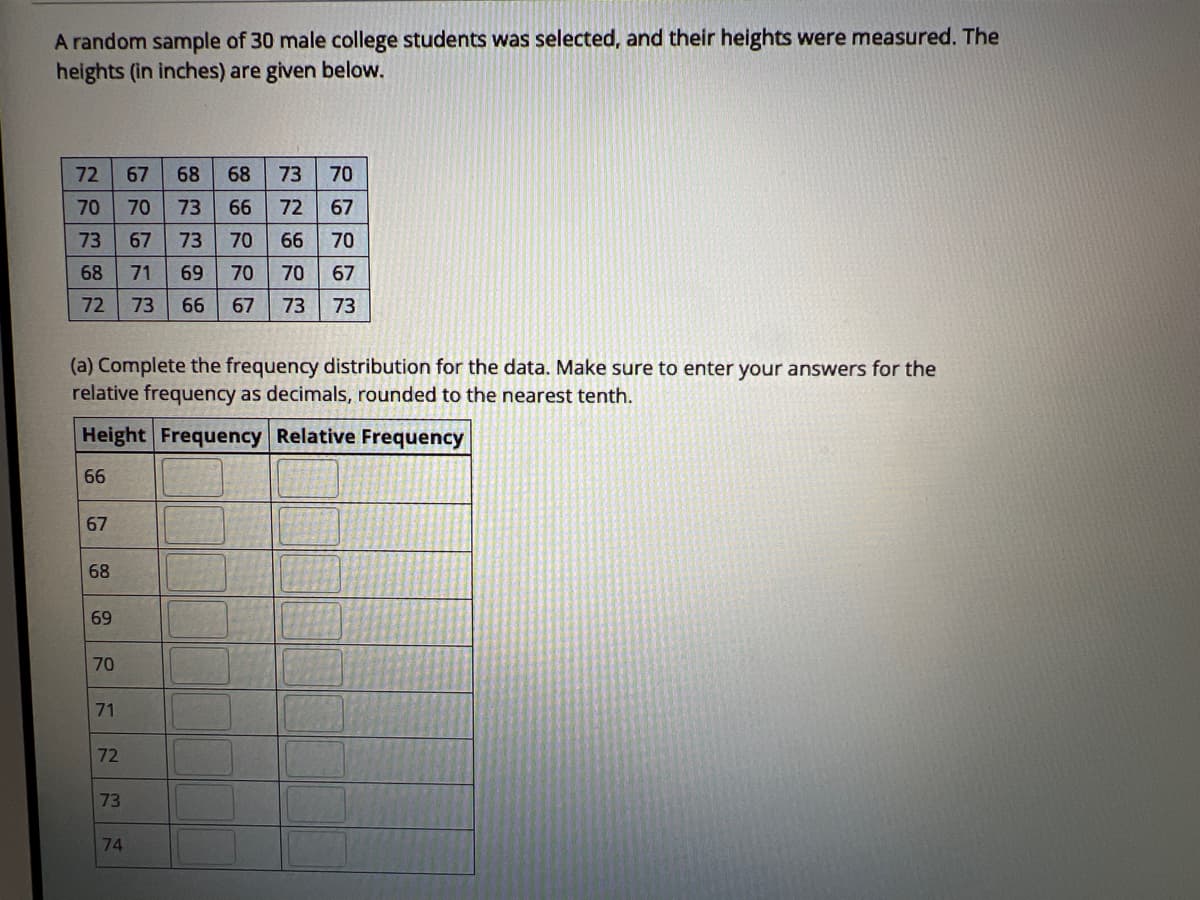
Transcribed Image Text:A random sample of 30 male college students was selected, and their heights were measured. The
heights (in inches) are given below.
72
67
68
68
73
70
70
70
73
66
72
67
73
67
73
70
66
70
68
71
69
70
70
67
72
73
66
67
73
73
(a) Complete the frequency distribution for the data. Make sure to enter your answers for the
relative frequency as decimals, rounded to the nearest tenth.
Height Frequency Relative Frequency
66
67
68
69
70
71
72
73
74
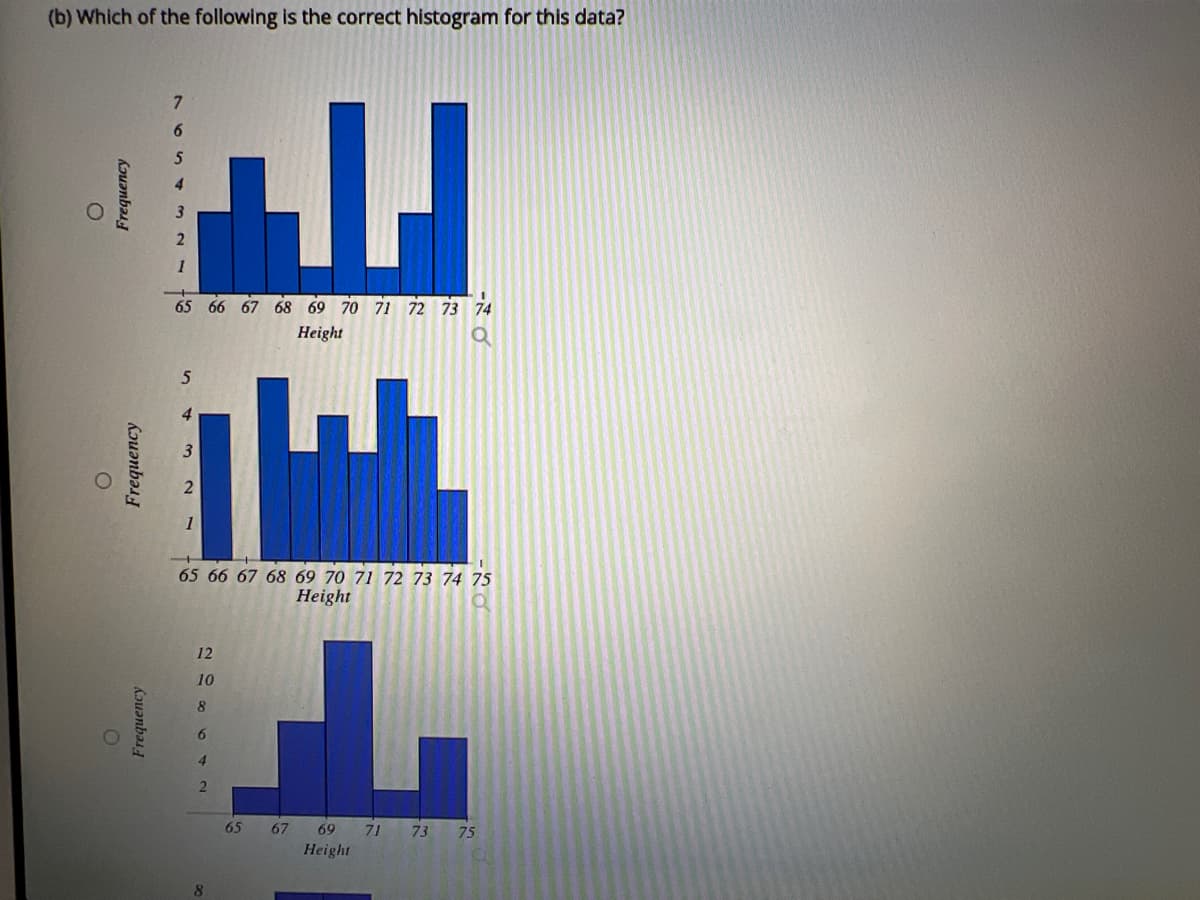
Transcribed Image Text:(b) Which of the following is the correct histogram for this data?
6.
5
65 66 67 68 69 70 71 72 73 74
Height
5
4
1
65 66 67 68 69 70 71 72 73 74 75
Height
12
10
8
6.
4.
65
67
69
71
73
75
Height
8.
Frequency
Frequency
Frequency
Expert Solution
Step 1
Given that.
Make a frequency distribution table with the help of given data.
Total sample (n) = 30.

Step by step
Solved in 3 steps with 1 images

Recommended textbooks for you
Glencoe Algebra 1, Student Edition, 9780079039897…
Algebra
ISBN:
9780079039897
Author:
Carter
Publisher:
McGraw Hill

Mathematics For Machine Technology
Advanced Math
ISBN:
9781337798310
Author:
Peterson, John.
Publisher:
Cengage Learning,
Glencoe Algebra 1, Student Edition, 9780079039897…
Algebra
ISBN:
9780079039897
Author:
Carter
Publisher:
McGraw Hill
Mathematics For Machine Technology
Advanced Math
ISBN:
9781337798310
Author:
Peterson, John.
Publisher:
Cengage Learning,