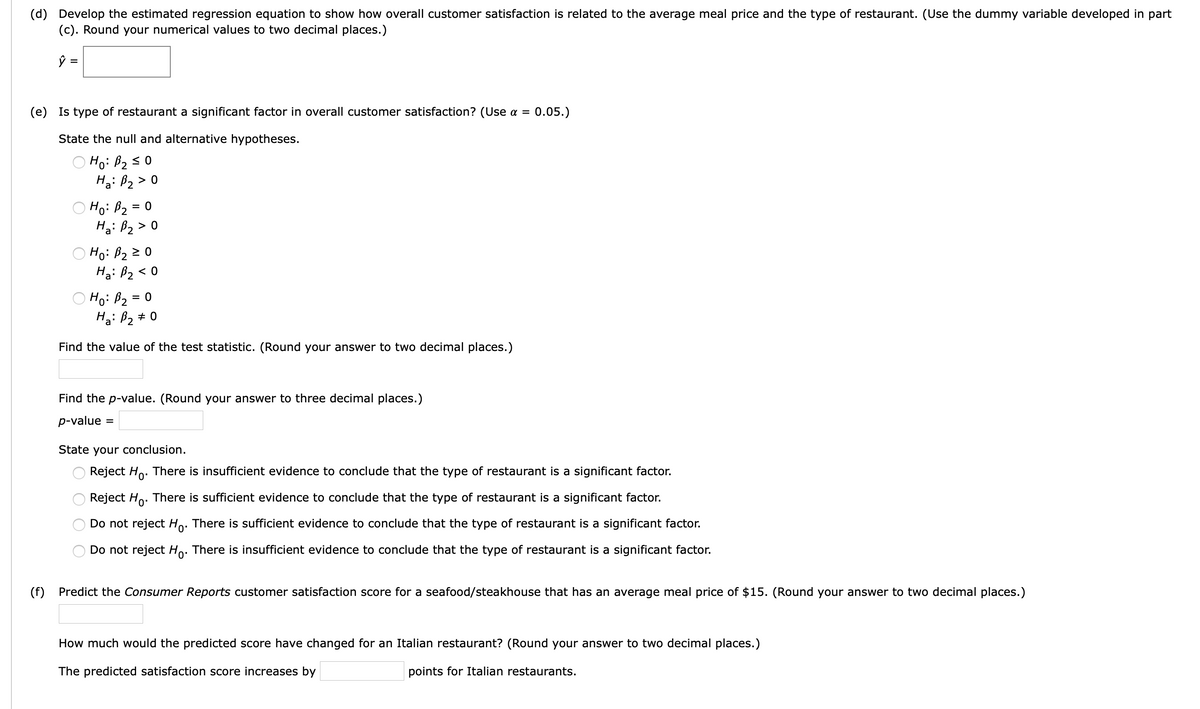
(c). Round your numerical values to two decimal places.) タ=


Unitary Method
The word “unitary” comes from the word “unit”, which means a single and complete entity. In this method, we find the value of a unit product from the given number of products, and then we solve for the other number of products.
Speed, Time, and Distance
Imagine you and 3 of your friends are planning to go to the playground at 6 in the evening. Your house is one mile away from the playground and one of your friends named Jim must start at 5 pm to reach the playground by walk. The other two friends are 3 miles away.
Profit and Loss
The amount earned or lost on the sale of one or more items is referred to as the profit or loss on that item.
Units and Measurements
Measurements and comparisons are the foundation of science and engineering. We, therefore, need rules that tell us how things are measured and compared. For these measurements and comparisons, we perform certain experiments, and we will need the experiments to set up the devices.
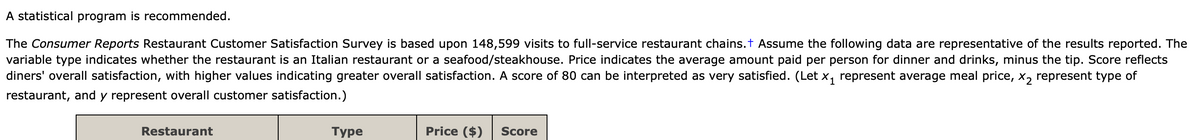
| Restaurant | Type | Price ($) | Score |
|---|---|---|---|
| Bertucci's | Italian | 16 | 77 |
| Black Angus Steakhouse | Seafood/Steakhouse | 24 | 79 |
| Bonefish Grill | Seafood/Steakhouse | 26 | 85 |
| Bravo! Cucina Italiana | Italian | 18 | 84 |
| Buca di Beppo | Italian | 17 | 81 |
| Bugaboo Creek Steak House | Seafood/Steakhouse | 18 | 77 |
| Carrabba's Italian Grill | Italian | 23 | 86 |
| Charlie Brown's Steakhouse | Seafood/Steakhouse | 17 | 75 |
| Il Fornaio | Italian | 28 | 83 |
| Joe's Crab Shack | Seafood/Steakhouse | 15 | 71 |
| Johnny Carino's | Italian | 17 | 81 |
| Lone Star Steakhouse & Saloon | Seafood/Steakhouse | 17 | 76 |
| Longhorn Steakhouse | Seafood/Steakhouse | 19 | 81 |
| Maggiano's Little Italy | Italian | 22 | 83 |
| McGrath's Fish House | Seafood/Steakhouse | 16 | 81 |
| Olive Garden | Italian | 19 | 81 |
| Outback Steakhouse | Seafood/Steakhouse | 20 | 80 |
| Red Lobster | Seafood/Steakhouse | 18 | 78 |
| Romano's Macaroni Grill | Italian | 18 | 82 |
| The Old Spaghetti Factory | Italian | 12 | 79 |
| Uno Chicago Grill | Italian | 16 | 76 |


Trending now
This is a popular solution!

Step by step
Solved in 2 steps with 2 images


