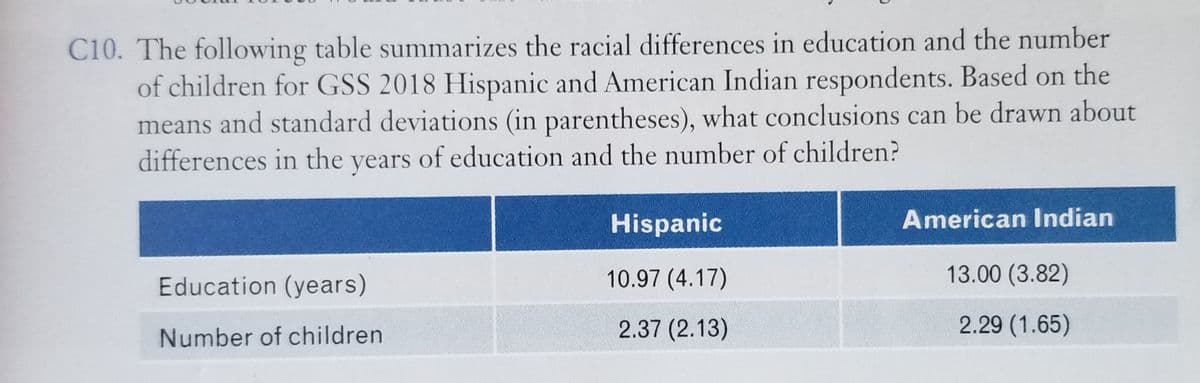
C10. The following table summarizes the racial differences in education and the number of children for GSS 2018 Hispanic and American Indian respondents. Based on the means and standard deviations (in parentheses), what conclusions can be drawn about differences in the years of education and the number of children? Hispanic American Indian Education (years) 10.97 (4.17) 13.00 (3.82) 2.37 (2.13) 2.29 (1.65) Number of children
C10. The following table summarizes the racial differences in education and the number of children for GSS 2018 Hispanic and American Indian respondents. Based on the means and standard deviations (in parentheses), what conclusions can be drawn about differences in the years of education and the number of children? Hispanic American Indian Education (years) 10.97 (4.17) 13.00 (3.82) 2.37 (2.13) 2.29 (1.65) Number of children

Glencoe Algebra 1, Student Edition, 9780079039897, 0079039898, 2018
18th Edition
ISBN:9780079039897
Author:Carter
Publisher:Carter
Chapter10: Statistics
Section10.4: Distributions Of Data
Problem 19PFA

Related questions
Question
Transcribed Image Text:C10. The following table summarizes the racial differences in education and the number
of children for GSS 2018 Hispanic and American Indian respondents. Based on the
means and standard deviations (in parentheses), what conclusions can be drawn about
differences in the years of education and the number of children?
Hispanic
American Indian
Education (years)
10.97 (4.17)
13.00 (3.82)
2.37 (2.13)
2.29 (1.65)
Number of children
Expert Solution
This question has been solved!
Explore an expertly crafted, step-by-step solution for a thorough understanding of key concepts.

This is a popular solution!

Trending now
This is a popular solution!

Step by step
Solved in 2 steps

Recommended textbooks for you
Glencoe Algebra 1, Student Edition, 9780079039897…
Algebra
ISBN:
9780079039897
Author:
Carter
Publisher:
McGraw Hill
Glencoe Algebra 1, Student Edition, 9780079039897…
Algebra
ISBN:
9780079039897
Author:
Carter
Publisher:
McGraw Hill