C2. Average years of education are reported by social class based on data from the GSS 2018 Mean Standard Deviation Lower class 12.19 3.08 102 Working class 13.16 2.93 523 Middle class 14.60 2.88 498 Upper class 15.21 3.01 34 a. Construct the 95% confidence interval for the mean number of years of education for lower- and working-class respondents. b. Construct the 99% confidence interval for the mean number of years of education for lower-class and middle-class respondents. c. As our confidence in the result increases, how does the size of the confidence interval Change? Explain why this is so.
C2. Average years of education are reported by social class based on data from the GSS 2018 Mean Standard Deviation Lower class 12.19 3.08 102 Working class 13.16 2.93 523 Middle class 14.60 2.88 498 Upper class 15.21 3.01 34 a. Construct the 95% confidence interval for the mean number of years of education for lower- and working-class respondents. b. Construct the 99% confidence interval for the mean number of years of education for lower-class and middle-class respondents. c. As our confidence in the result increases, how does the size of the confidence interval Change? Explain why this is so.

Glencoe Algebra 1, Student Edition, 9780079039897, 0079039898, 2018
18th Edition
ISBN:9780079039897
Author:Carter
Publisher:Carter
Chapter10: Statistics
Section10.4: Distributions Of Data
Problem 19PFA

Related questions

Question
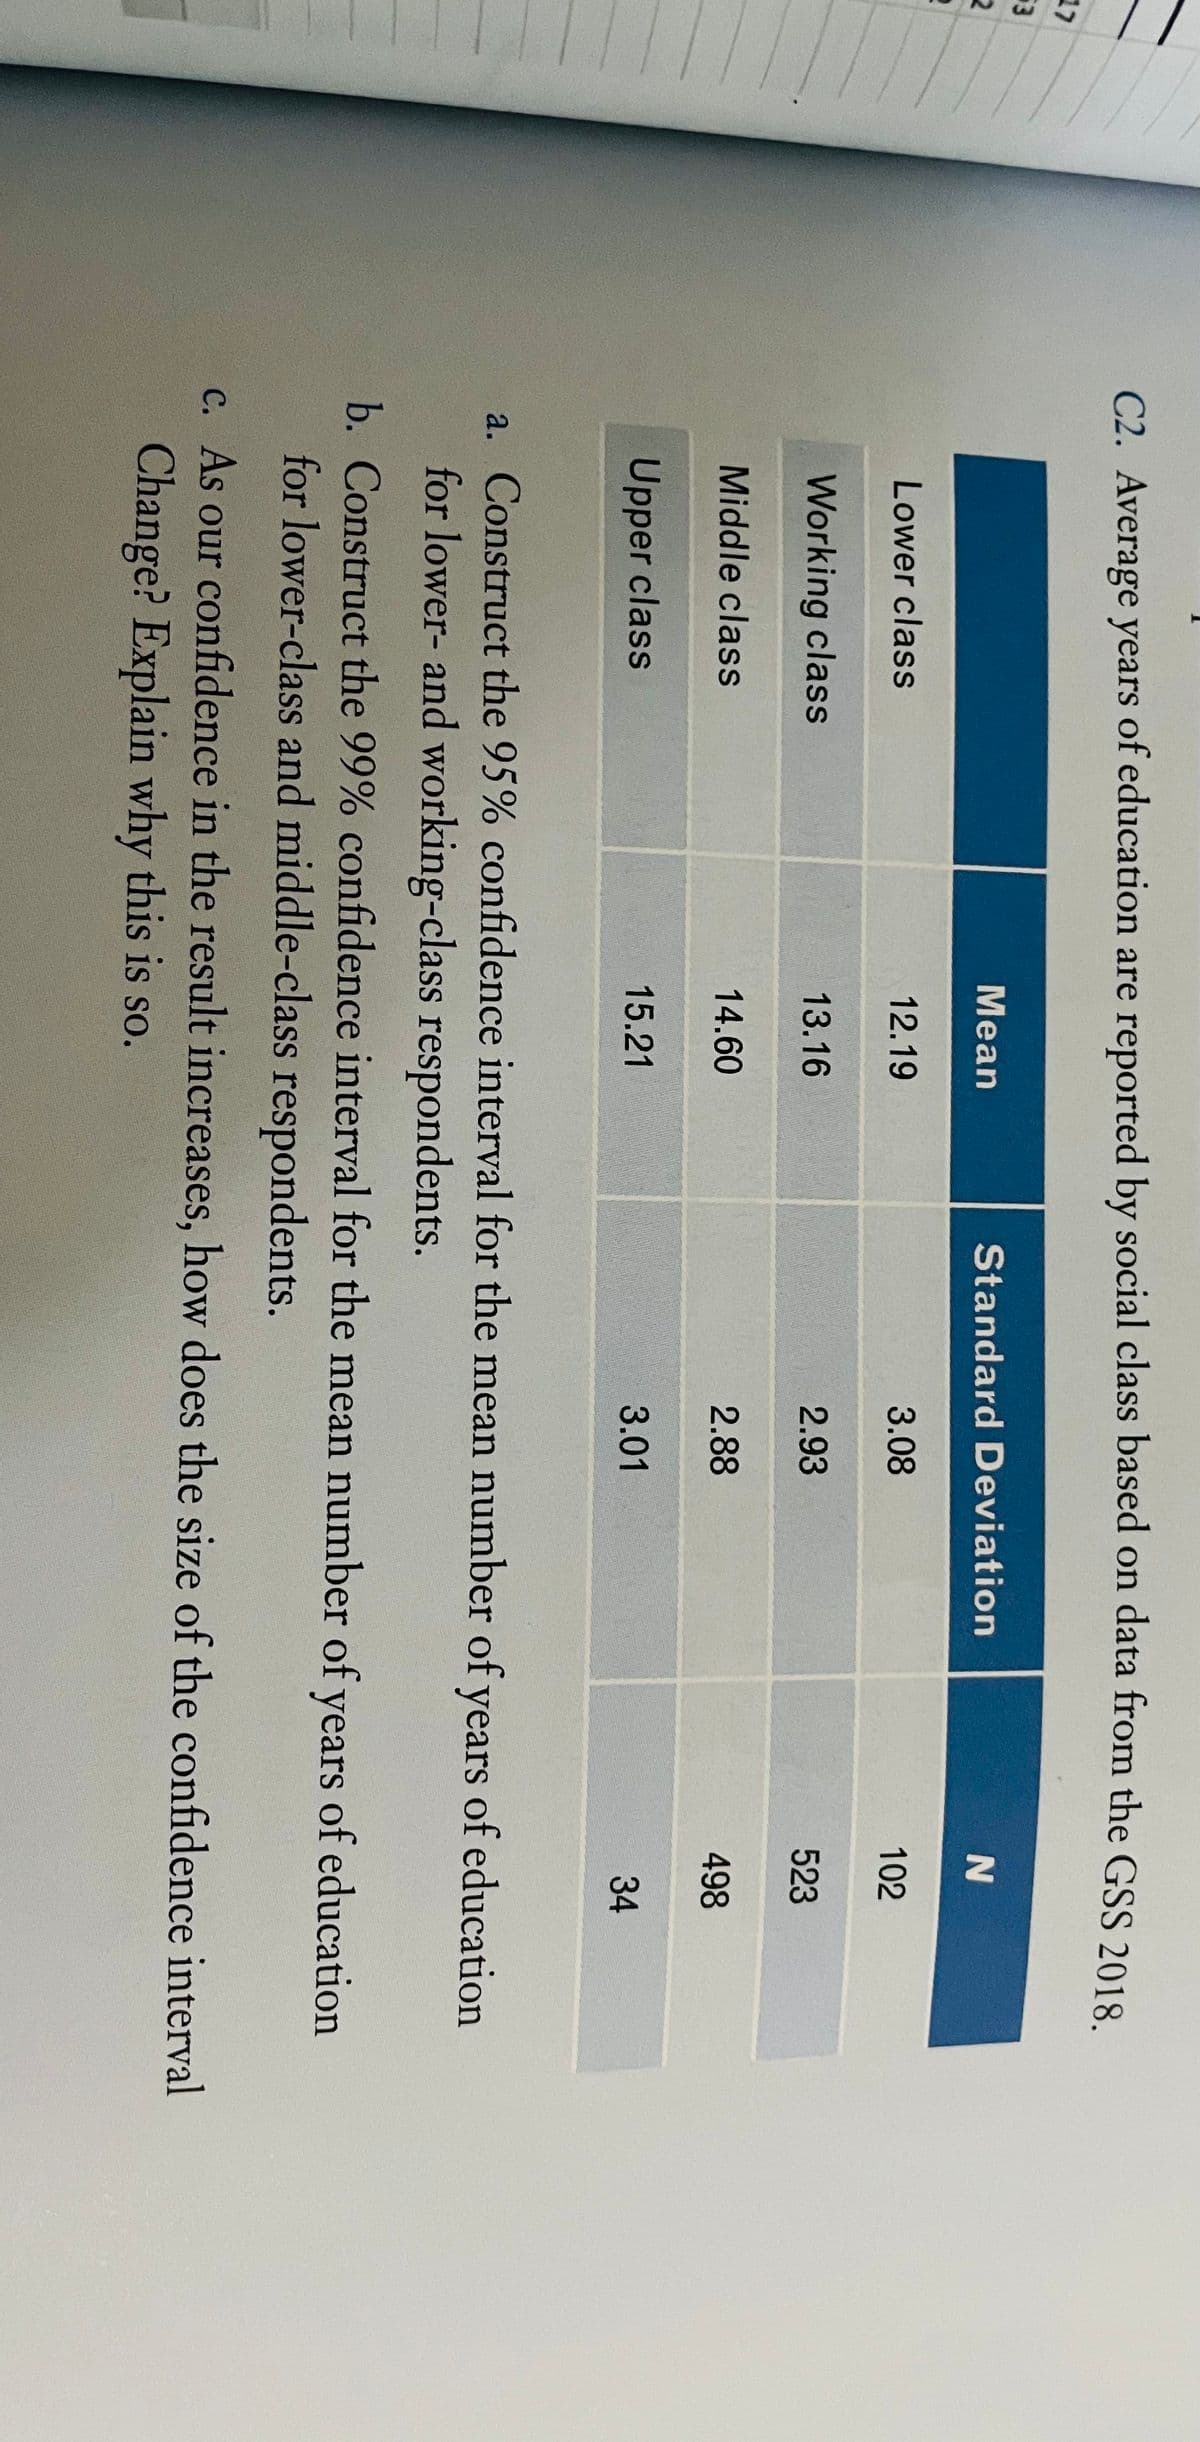
Transcribed Image Text:C2. Average years of education are reported by social class based on data from the GSS 2019
17
Mean
Standard Deviation
2
12.19
3.08
102
Lower class
13.16
2.93
523
Working class
14.60
2.88
498
Middle class
15.21
3.01
34
Upper class
a. Construct the 95% confidence interval for the mean number of years of education
for lower- and working-class respondents.
of education
b. Construct the 99% confidence interval for the mean number of years
for lower-class and middle-class respondents.
c. As our confidence in the result increases, how does the size of the confidence interval
Change? Explain why this is so.
Expert Solution
This question has been solved!
Explore an expertly crafted, step-by-step solution for a thorough understanding of key concepts.

This is a popular solution!

Trending now
This is a popular solution!

Step by step
Solved in 2 steps with 1 images

Knowledge Booster


Learn more about
Need a deep-dive on the concept behind this application? Look no further. Learn more about this topic, statistics and related others by exploring similar questions and additional content below.Recommended textbooks for you
Glencoe Algebra 1, Student Edition, 9780079039897…
Algebra
ISBN:
9780079039897
Author:
Carter
Publisher:
McGraw Hill
Glencoe Algebra 1, Student Edition, 9780079039897…
Algebra
ISBN:
9780079039897
Author:
Carter
Publisher:
McGraw Hill