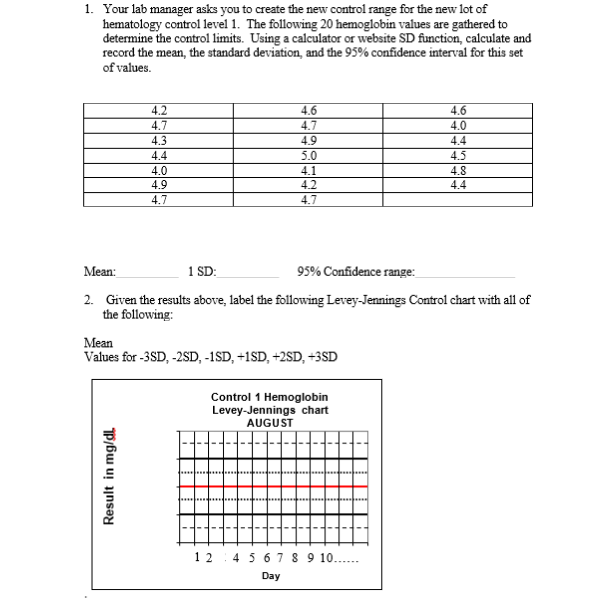
1. Your lab manager asks you to create the new control range for the new lot of hematology control level 1. The following 20 hemoglobin values are gathered to determine the control limits. Using a calculator or website SD function, calculate and record the mean, the standard deviation, and the 95% confidence interval for this set of values. 4.2 4.7 4.3 4.6 4.7 4.9 4.6 4.0 4.4 4.4 5.0 4.5 4.0 4.1 4.8 4.4 4.9 4.7 4.2 4.7 Mean: 1 SD: 95% Confidence range:
1. Your lab manager asks you to create the new control range for the new lot of hematology control level 1. The following 20 hemoglobin values are gathered to determine the control limits. Using a calculator or website SD function, calculate and record the mean, the standard deviation, and the 95% confidence interval for this set of values. 4.2 4.7 4.3 4.6 4.7 4.9 4.6 4.0 4.4 4.4 5.0 4.5 4.0 4.1 4.8 4.4 4.9 4.7 4.2 4.7 Mean: 1 SD: 95% Confidence range:

Glencoe Algebra 1, Student Edition, 9780079039897, 0079039898, 2018
18th Edition
ISBN:9780079039897
Author:Carter
Publisher:Carter
Chapter10: Statistics
Section10.4: Distributions Of Data
Problem 19PFA

Related questions
Question
Transcribed Image Text:1. Your lab manager asks you to create the new control range for the new lot of
hematology control level 1. The following 20 hemoglobin values are gathered to
determine the control limits. Using a calculator or website SD function, calculate and
record the mean, the standard deviation, and the 95% confidence interval for this set
of values.
4.2
4.7
4.3
4.6
4.7
4.9
4.6
4.0
4.4
4.4
5.0
4.5
4.0
4.1
4.8
4.4
4.9
4.7
4.2
4.7
Mean:
1 SD:
95% Confidence range:
2. Given the results above, label the following Levey-Jennings Control chart with all of
the following:
Mean
Values for -3SD, -2SD, -1SD, +1SD, +2SD, +3SD
Control 1 Hemoglobin
Levey-Jennings chart
AUGUST
1 2
4 5 67 8 9 10..
Day
Result in mg/dL
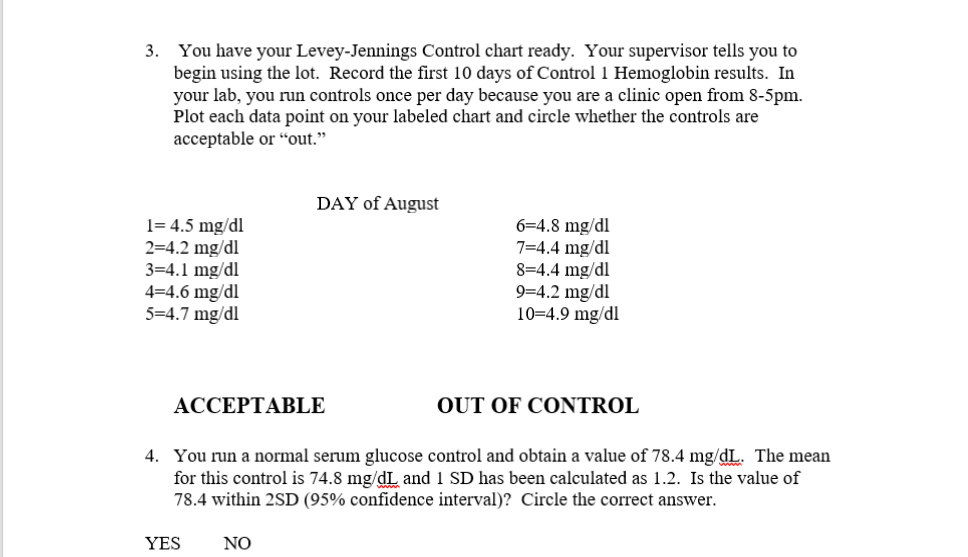
Transcribed Image Text:3. You have your Levey-Jennings Control chart ready. Your supervisor tells you to
begin using the lot. Record the first 10 days of Control 1 Hemoglobin results. In
your lab, you run controls once per day because you are a clinic open from 8-5pm.
Plot each data point on your labeled chart and circle whether the controls are
acceptable or “out."
DAY of August
1= 4.5 mg/dl
2=4.2 mg/dl
3=4.1 mg/dl
4=4.6 mg/dl
5=4.7 mg/dl
6=4.8 mg/dl
7=4.4 mg/dl
8=4.4 mg/dl
9=4.2 mg/dl
10=4.9 mg/dl
ACCEPTΑBLE
OUT OF CONTROL
4. You run a normal serum glucose control and obtain a value of 78.4 mg/dL. The mean
for this control is 74.8 mg/dL and 1 SD has been calculated as 1.2. Is the value of
78.4 within 2SD (95% confidence interval)? Circle the correct answer.
YES
NO
Expert Solution
This question has been solved!
Explore an expertly crafted, step-by-step solution for a thorough understanding of key concepts.

This is a popular solution!

Trending now
This is a popular solution!

Step by step
Solved in 2 steps with 2 images

Recommended textbooks for you
Glencoe Algebra 1, Student Edition, 9780079039897…
Algebra
ISBN:
9780079039897
Author:
Carter
Publisher:
McGraw Hill
Glencoe Algebra 1, Student Edition, 9780079039897…
Algebra
ISBN:
9780079039897
Author:
Carter
Publisher:
McGraw Hill