C8. GSS 2018 respondents were asked their views on teens (between the ages of 14 and 16) engaging in sex before marriage (TEENSEX). Responses are cross-tabulated by educational attainment (DEGREE). a. What percentage of those surveyed felt teen sex was always wrong? b. What percentage of those with less than a high school diploma felt teen sex was always wrong? c. What percentage of those with a graduate degree felt teen sex was always wrong? d Intornnot th
C8. GSS 2018 respondents were asked their views on teens (between the ages of 14 and 16) engaging in sex before marriage (TEENSEX). Responses are cross-tabulated by educational attainment (DEGREE). a. What percentage of those surveyed felt teen sex was always wrong? b. What percentage of those with less than a high school diploma felt teen sex was always wrong? c. What percentage of those with a graduate degree felt teen sex was always wrong? d Intornnot th

Glencoe Algebra 1, Student Edition, 9780079039897, 0079039898, 2018
18th Edition
ISBN:9780079039897
Author:Carter
Publisher:Carter
Chapter10: Statistics
Section10.5: Comparing Sets Of Data
Problem 26PFA

Related questions
Question
Transcribed Image Text:26,
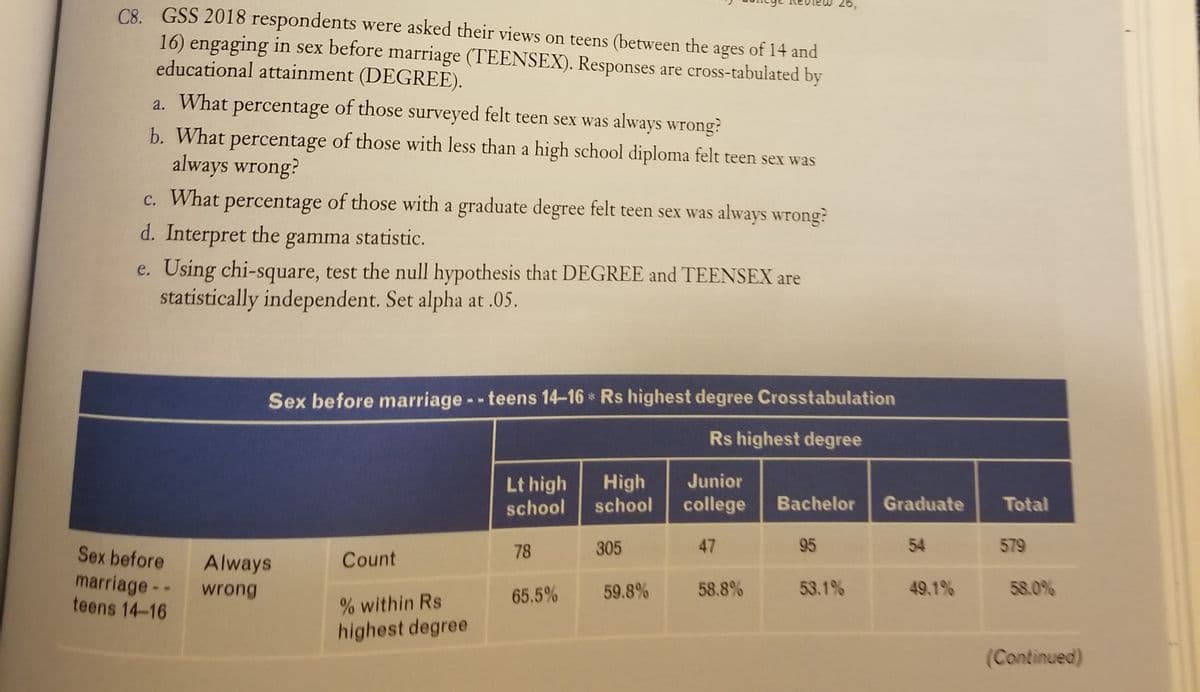
C8. GSS 2018 respondents were asked their views on teens (between the ages of 14 and
16) engaging in sex before marriage (TEENSEX). Responses are cross-tabulated by
educational attainment (DEGREE).
a. What percentage of those surveyed felt teen sex was always wrong?
b. What percentage of those with less than a high school diploma felt teen sex was
always wrong?
c. What
percentage of those with a graduate degree felt teen sex was always wrong?
с.
d. Interpret the
gamma statistic.
e. Using chi-square, test the null hypothesis that DEGREE and TEENSEX are
statistically independent. Set alpha at .05.
Sex before marriage --teens 14-16 * Rs highest degree Crosstabulation
Rs highest degree
Junior
Lt high
school
High
school
college
Bachelor
Graduate
Total
Sex before
Count
78
305
47
95
54
579
Always
marriage--
teens 14-16
wrong
65.5%
59.8%
58.8%
53.1%
49.1%
58.0%
% within Rs
highest degree
(Continued)
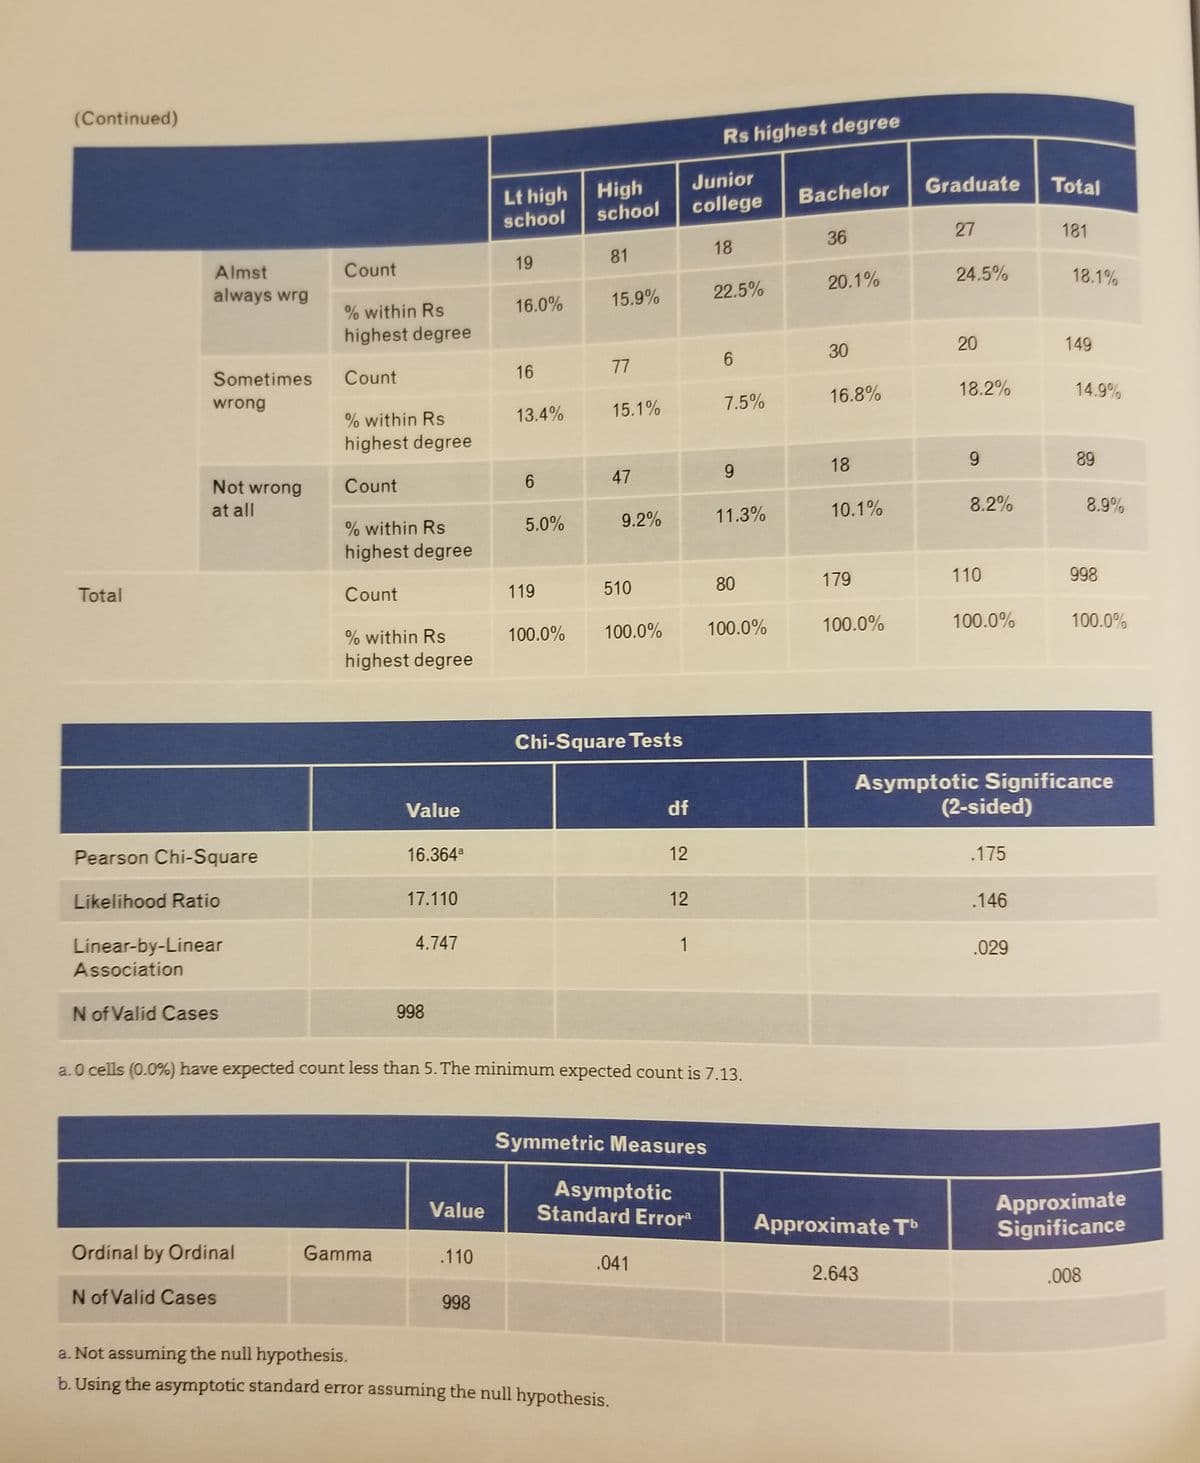
Transcribed Image Text:(Continued)
Rs highest degree
Junior
Graduate
Total
High
school
Lt high
Bachelor
college
school
27
181
36
18
81
19
Almst
Count
24.5%
18.1%
20.1%
always wrg
15.9%
22.5%
% within Rs
16.0%
highest degree
20
149
30
6.
16
77
Sometimes
Count
16.8%
18.2%
14.9%
wrong
15.1%
7.5%
% within Rs
13.4%
highest degree
18
9.
89
47
9.
Not wrong
Count
6.
at all
10.1%
8.2%
8.9%
5.0%
9.2%
11.3%
% within Rs
highest degree
179
110
998
Total
Count
119
510
80
100.0%
100.0%
100.0%
100.0%
100.0%
% within Rs
100.0%
highest degree
Chi-Square Tests
Asymptotic Significance
(2-sided)
Value
df
Pearson Chi-Square
16.364a
12
.175
Likelihood Ratio
17.110
12
.146
4.747
Linear-by-Linear
Association
1
.029
N of Valid Cases
998
a.0 cells (0.0%) have expected count less than 5. The minimum expected count is 7.13.
Symmetric Measures
Asymptotic
Standard Errora
Approximate
Significance
Value
Approximate T
Ordinal by Ordinal
Gamma
.110
.041
2.643
.008
N of Valid Cases
998
a. Not assuming the null hypothesis.
b. Using the asymptotic standard error assuming the null hypothesis.
Expert Solution
This question has been solved!
Explore an expertly crafted, step-by-step solution for a thorough understanding of key concepts.

This is a popular solution!

Trending now
This is a popular solution!

Step by step
Solved in 4 steps

Recommended textbooks for you
Glencoe Algebra 1, Student Edition, 9780079039897…
Algebra
ISBN:
9780079039897
Author:
Carter
Publisher:
McGraw Hill

Big Ideas Math A Bridge To Success Algebra 1: Stu…
Algebra
ISBN:
9781680331141
Author:
HOUGHTON MIFFLIN HARCOURT
Publisher:
Houghton Mifflin Harcourt
Glencoe Algebra 1, Student Edition, 9780079039897…
Algebra
ISBN:
9780079039897
Author:
Carter
Publisher:
McGraw Hill
Big Ideas Math A Bridge To Success Algebra 1: Stu…
Algebra
ISBN:
9781680331141
Author:
HOUGHTON MIFFLIN HARCOURT
Publisher:
Houghton Mifflin Harcourt