Calcium is essential to tree growth. In 1990, the concentration of calcium in precipitation in Chautauqua, New York, mg (19) was 0.11 milligram per liter 0.126 0.183 A random sample of 8 precipitation dates in 2018 results in the following data: 0.120 0.065 0.087 O A normal probability plot suggests the data could come from a population that is normally distributed. A boxplot does not show any outliers. Does the sample evidence suggest that calcium concentrations have changed since 1990? Use the a=0.1 level of significance. 0.234 0.313 0.108
Calcium is essential to tree growth. In 1990, the concentration of calcium in precipitation in Chautauqua, New York, mg (19) was 0.11 milligram per liter 0.126 0.183 A random sample of 8 precipitation dates in 2018 results in the following data: 0.120 0.065 0.087 O A normal probability plot suggests the data could come from a population that is normally distributed. A boxplot does not show any outliers. Does the sample evidence suggest that calcium concentrations have changed since 1990? Use the a=0.1 level of significance. 0.234 0.313 0.108

MATLAB: An Introduction with Applications
6th Edition
ISBN:9781119256830
Author:Amos Gilat
Publisher:Amos Gilat
Chapter1: Starting With Matlab
Section: Chapter Questions
Problem 1P

Related questions
Question
Pls answer both
To find P-Value—
To find t0=
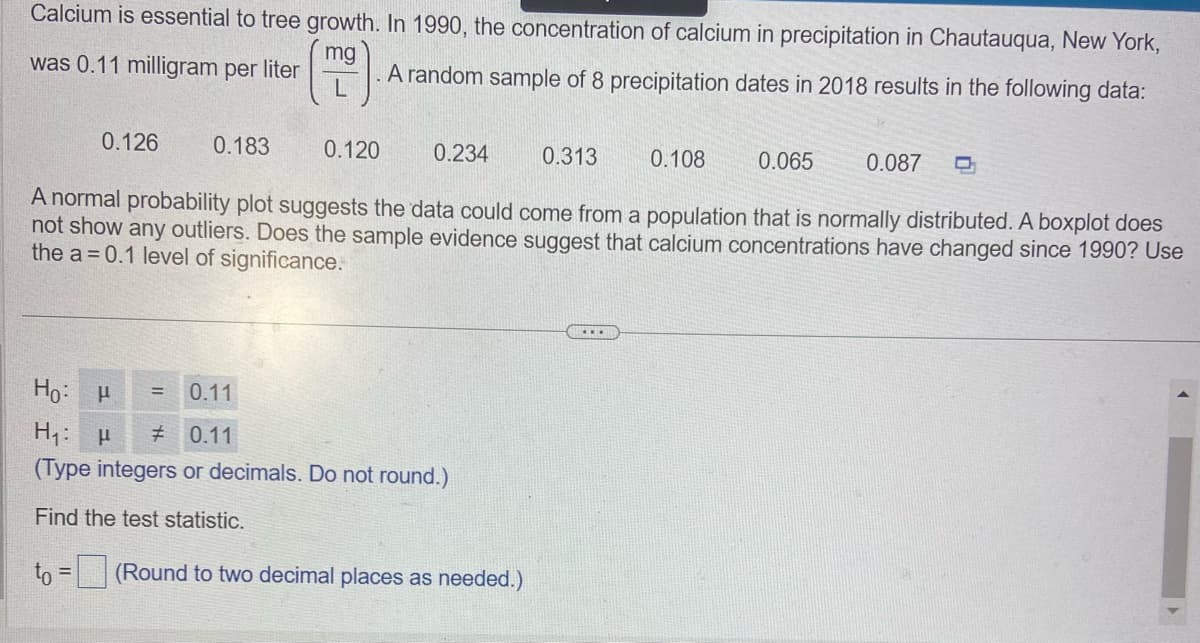
Transcribed Image Text:Calcium is essential to tree growth. In 1990, the concentration of calcium in precipitation in Chautauqua, New York,
mg
was 0.11 milligram per liter
A random sample of 8 precipitation dates in 2018 results in the following data:
0.126
0.183
0.120
0.234 0.313
Ho: P = 0.11
H₁: μ # 0.11
(Type integers or decimals. Do not round.)
Find the test statistic.
to = (Round to two decimal places as needed.)
0.108
...
0.065
A normal probability plot suggests the data could come from a population that is normally distributed. A boxplot does
not show any outliers. Does the sample evidence suggest that calcium concentrations have changed since 1990? Use
the a=0.1 level of significance.
0.087 O
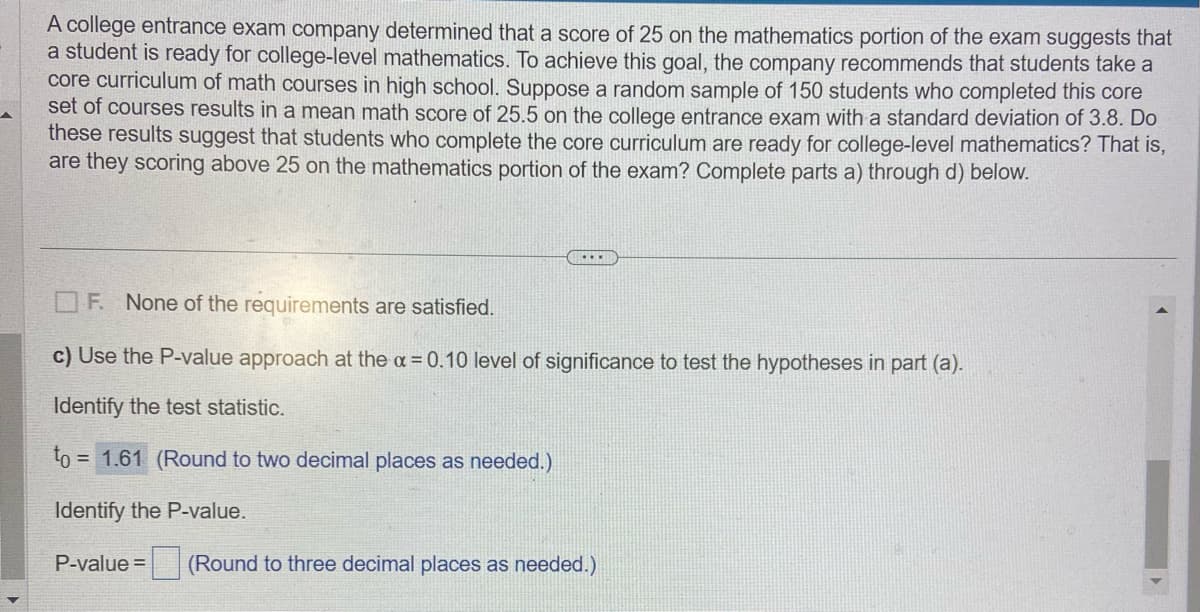
Transcribed Image Text:A college entrance exam company determined that a score of 25 on the mathematics portion of the exam suggests that
a student is ready for college-level mathematics. To achieve this goal, the company recommends that students take a
core curriculum of math courses in high school. Suppose a random sample of 150 students who completed this core
set of courses results in a mean math score of 25.5 on the college entrance exam with a standard deviation of 3.8. Do
these results suggest that students who complete the core curriculum are ready for college-level mathematics? That is,
are they scoring above 25 on the mathematics portion of the exam? Complete parts a) through d) below.
...
F. None of the requirements are satisfied.
c) Use the P-value approach at the α = 0.10 level of significance to test the hypotheses in part (a).
Identify the test statistic.
to = = 1.61 (Round to two decimal places as needed.)
Identify the P-value.
P-value =
(Round to three decimal places as needed.)
Expert Solution
This question has been solved!
Explore an expertly crafted, step-by-step solution for a thorough understanding of key concepts.

This is a popular solution!

Trending now
This is a popular solution!

Step by step
Solved in 3 steps with 3 images

Recommended textbooks for you
MATLAB: An Introduction with Applications
Statistics
ISBN:
9781119256830
Author:
Amos Gilat
Publisher:
John Wiley & Sons Inc

Probability and Statistics for Engineering and th…
Statistics
ISBN:
9781305251809
Author:
Jay L. Devore
Publisher:
Cengage Learning

Statistics for The Behavioral Sciences (MindTap C…
Statistics
ISBN:
9781305504912
Author:
Frederick J Gravetter, Larry B. Wallnau
Publisher:
Cengage Learning
MATLAB: An Introduction with Applications
Statistics
ISBN:
9781119256830
Author:
Amos Gilat
Publisher:
John Wiley & Sons Inc
Probability and Statistics for Engineering and th…
Statistics
ISBN:
9781305251809
Author:
Jay L. Devore
Publisher:
Cengage Learning
Statistics for The Behavioral Sciences (MindTap C…
Statistics
ISBN:
9781305504912
Author:
Frederick J Gravetter, Larry B. Wallnau
Publisher:
Cengage Learning

Elementary Statistics: Picturing the World (7th E…
Statistics
ISBN:
9780134683416
Author:
Ron Larson, Betsy Farber
Publisher:
PEARSON

The Basic Practice of Statistics
Statistics
ISBN:
9781319042578
Author:
David S. Moore, William I. Notz, Michael A. Fligner
Publisher:
W. H. Freeman

Introduction to the Practice of Statistics
Statistics
ISBN:
9781319013387
Author:
David S. Moore, George P. McCabe, Bruce A. Craig
Publisher:
W. H. Freeman