Calculate correlation coefficient from the following data : N= 10, Σ X= 140 , Σ Υ-150 E (X – 10)2 = 180, E(Y– 15)² = 215, E (X- 10) (Y– 15) = 60 %3D %3D %3D
Calculate correlation coefficient from the following data : N= 10, Σ X= 140 , Σ Υ-150 E (X – 10)2 = 180, E(Y– 15)² = 215, E (X- 10) (Y– 15) = 60 %3D %3D %3D

Functions and Change: A Modeling Approach to College Algebra (MindTap Course List)
6th Edition
ISBN:9781337111348
Author:Bruce Crauder, Benny Evans, Alan Noell
Publisher:Bruce Crauder, Benny Evans, Alan Noell
Chapter3: Straight Lines And Linear Functions
Section3.4: Linear Regression
Problem 12SBE: Find the equation of the regression line for the following data set. x 1 2 3 y 0 3 4

Related questions
Question
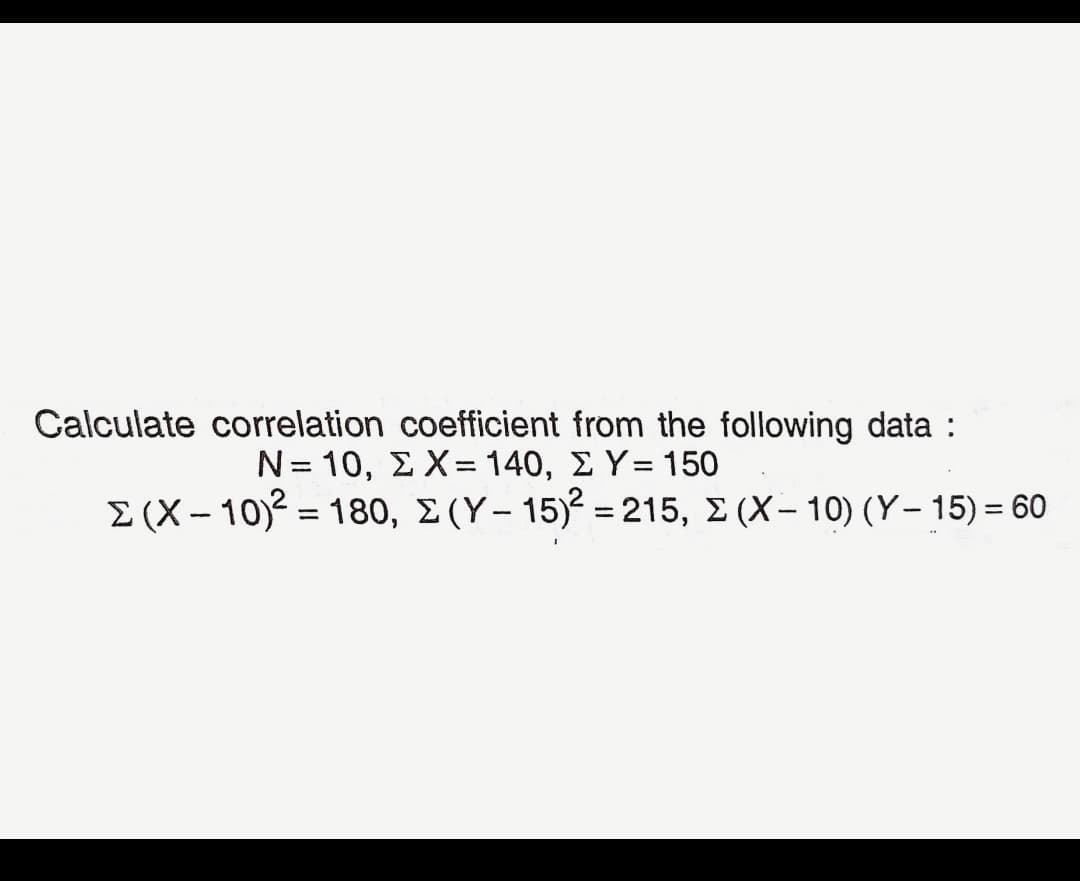
Transcribed Image Text:Calculate correlation coefficient from the following data :
N= 10, E X= 140, E Y= 150
E (X – 10)2 = 180, E(Y– 15)² = 215, E (X- 10) (Y– 15) = 60
%3D
%3D
%3D
%3D
Expert Solution
This question has been solved!
Explore an expertly crafted, step-by-step solution for a thorough understanding of key concepts.

This is a popular solution!

Trending now
This is a popular solution!

Step by step
Solved in 3 steps with 3 images

Recommended textbooks for you
Functions and Change: A Modeling Approach to Coll…
Algebra
ISBN:
9781337111348
Author:
Bruce Crauder, Benny Evans, Alan Noell
Publisher:
Cengage Learning

Algebra & Trigonometry with Analytic Geometry
Algebra
ISBN:
9781133382119
Author:
Swokowski
Publisher:
Cengage

Functions and Change: A Modeling Approach to Coll…
Algebra
ISBN:
9781337111348
Author:
Bruce Crauder, Benny Evans, Alan Noell
Publisher:
Cengage Learning
Algebra & Trigonometry with Analytic Geometry
Algebra
ISBN:
9781133382119
Author:
Swokowski
Publisher:
Cengage