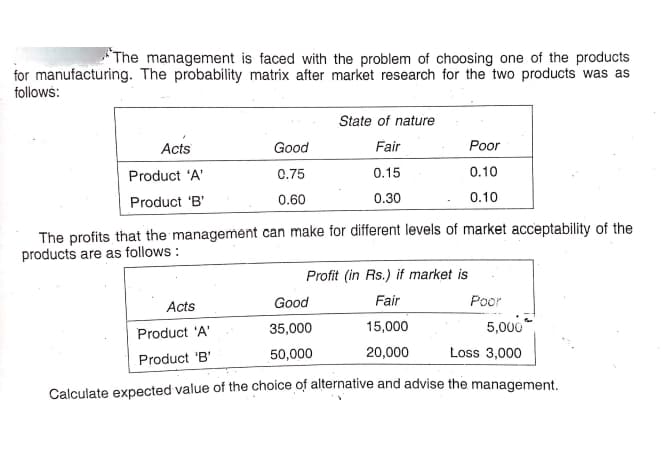
Calculate expected value of the choice of alternative and advise the management.


Q: Provide four (4) reasons/justifications for each of the strategies given in the solution above.
A: Strategy can be described as - the approach an association takes with the purpose of performing…
Q: Write an executive summary for an ice cream business shop located in Turkey. Their main goal is to…
A: Executive Summary: In Turkey, selling ice cream is a very popular industry. In the suburbs of…
Q: suppose your business is rental cloth collection, explain specifically the markets competitive…
A: Rental cloth collection is business where the cloth are provided for rent to the user for a…
Q: evaluating strategies on a continuous rather than a periodic basis is desired
A: Evaluating strategies includes recognizing the strategy to be implement in a particular period…
Q: Posing choices for the prospect in which either alternative represents a sale.“Would you prefer to…
A: Marketing covers vast topic including many areas like pricing, packaging, marketing mix, marketing…
Q: Explain the term dramatic competitive edge.
A: Competition for the market refers to the efforts and competitive strategies practiced by the firms…
Q: Based on the relationship and agreement with the vendors, what are the 2 vendor workflow options to…
A: Vendors play a very important role in any industry or in the organization. Sometimes they are also…
Q: Describe the components of active planning in operations planning for an organization
A: The emphasis of scheduling, a subset of planning and controlling, is on the creation of methods and…
Q: What are the responsibilities of Supply Chain Manager and Planner?
A: Supply chain management is the active management of supply chain activities to maximize customer…
Q: Following are some of the information on demand and costs of a mobile phone manufacturer: Monthly…
A: The EOQ could be a company's best order amount that minimizes its total prices associated with…
Q: nalyse the principles, strategies of effective procurement and sourcing processes that would boost…
A: A procurement strategy fact how a corporate should agree with its obtaining process. This offers an…
Q: what characteristic of the hospitality and tourism product is described in the following scenario:…
A: Answer : OPTION A Perishability
Q: H&M Industry Analysis and Competitor Analysis
A: H&M: It is a global brand that operates in around 60 countries. It uses internationalisation…
Q: Explain the supply solutions that are used in sales and operations planning?
A: The supply chain is described as the mechanism by which firms/organizations participate in the…
Q: Describes how quality, speed, dependability, flexibility and cost impact on the hotel’s external…
A: Quality: Doing things correctly is also known as quality. In operations, however, it varies…
Q: Explain how operational risk arises
A: Operational risk is the risk that affecting the operations of the business that may lead to…
Q: Identify the seven steps in the strategic sourcing process; Explain the steps in the strategic…
A: The strategic sourcing process or plan is highly essential for critical items or services, the buyer…
Q: Pineapple Co.'s revenue and total costs are $3,000,000 and $1,500,000, respectively, in 2019.…
A: Revenue = $3,000,000 Total Costs = $1,500,000 Profit = Revenue - Total Costs =…
Q: Suppose that you have a service business such as house painting. Describe how you would use…
A: Cost plus pricing is used to determine the price of an offering. Cost plus pricing simply adds a…
Q: what is the potential market and market size of protein bars?
A: Protein bars are focused on people who basically need a helpful wellspring of protein that doesn't…
Q: Choose a service firm you are familiar with and describe how it has made the fourkey decisions of:…
A: Firm chosen: Commercial bank Service offering: Commerce bank determined to serve customers who…
Q: elling.
A: Sponsorship is one kind of marketing or promotional tool available for the marketers to increase…
Q: Situation #1: You are working in a restaurant as a sale staff. The Operation Manager requested you…
A: We can say that where you might want to incorporate information about the products that each…
Q: ome companies import and export flowers worldwide. It is one of the very competitive businesses in…
A: Fresh Phool Co. is located in Pakistan . The organization do the business of export of flowers. The…
Q: Why Use ABC Analysis and what are their limitation?
A: When it comes to inventory, ABC analysis can help you keep your working capital costs under control.…
Q: Hi there can you please assist on the following questions below You have been recently appointed as…
A: Insourcing (In house) is the process of providing or making goods & services on behalf of the…
Q: management
A: Strong management leads to the success of a business organization. On the other hand, the business…
Q: Discuss each of the following objectives listed and the relationship each has withjob shop…
A: Customer service is described as providing assistance and advice to the people that buys and uses…
Q: flower model regarding the product aspect of service for Starbucks
A: A helpful idea in marketing is the "Flower of Service." It can be used to observe how essential…
Q: Identify the competitive edge and explain the requirements that the sharp company should do to…
A: A competitive edge: A competitive edge means to remain at the head of their rivalry. This is…
Q: When reviewing a Profit and Loss report in QuickBooks Online, which report option will quickly show…
A: Answer: Compare another period > Previous year (PY) Explanation: Go to modify report tab, under…
Q: Understand how forecasting is essential to supply chain planning.
A: Forecasting is the process of identifying the demand accurately for future production planning and…
Q: Miss. Sara is a Marketing Manager of a large events management company. The company arranges…
A: There are various business organizations that have been established in the world. This has been made…
Q: Select a product of Procter & Gamble company and discuss what are the main raw materials for making…
A: P&G, or Procter & Gamble, is the world's largest consumer goods corporation. It primarily…
Q: Calculate the profit leverage effect of sourcing and explain its importance.
A: The profit-leverage effect means that if the purchasing costs constitute a major portion of the…
Q: explain briefly what does it mean "Not an issue of affordability but lack of support and priority"?
A: Science and technology involves a huge investment and infrastructural support from the country's…
Q: Which goods and services are included in basket of goods and services to calculate CPI? Why are…
A: The Consumer Price Index, or CPI, is a measure of retail inflation in the economy that collects…
Q: 3. Identify under which type of cost center canteen belongs to. a.Manufacturing b.Personal…
A: Cost center refers to those departments of a company that do not contribute to the revenue or…

Step by step
Solved in 2 steps with 2 images

- Based on Babich (1992). Suppose that each week each of 300 families buys a gallon of orange juice from company A, B, or C. Let pA denote the probability that a gallon produced by company A is of unsatisfactory quality, and define pB and pC similarly for companies B and C. If the last gallon of juice purchased by a family is satisfactory, the next week they will purchase a gallon of juice from the same company. If the last gallon of juice purchased by a family is not satisfactory, the family will purchase a gallon from a competitor. Consider a week in which A families have purchased juice A, B families have purchased juice B, and C families have purchased juice C. Assume that families that switch brands during a period are allocated to the remaining brands in a manner that is proportional to the current market shares of the other brands. For example, if a customer switches from brand A, there is probability B/(B + C) that he will switch to brand B and probability C/(B + C) that he will switch to brand C. Suppose that the market is currently divided equally: 10,000 families for each of the three brands. a. After a year, what will the market share for each firm be? Assume pA = 0.10, pB = 0.15, and pC = 0.20. (Hint: You will need to use the RISKBINOMLAL function to see how many people switch from A and then use the RISKBENOMIAL function again to see how many switch from A to B and from A to C. However, if your model requires more RISKBINOMIAL functions than the number allowed in the academic version of @RISK, remember that you can instead use the BENOM.INV (or the old CRITBENOM) function to generate binomially distributed random numbers. This takes the form =BINOM.INV (ntrials, psuccess, RAND()).) b. Suppose a 1% increase in market share is worth 10,000 per week to company A. Company A believes that for a cost of 1 million per year it can cut the percentage of unsatisfactory juice cartons in half. Is this worthwhile? (Use the same values of pA, pB, and pC as in part a.)A new edition of a very popular textbook will be published a year from now. The publisher currently has 1000 copies on hand and is deciding whether to do another printing before the new edition comes out. The publisher estimates that demand for the book during the next year is governed by the probability distribution in the file P10_31.xlsx. A production run incurs a fixed cost of 15,000 plus a variable cost of 20 per book printed. Books are sold for 190 per book. Any demand that cannot be met incurs a penalty cost of 30 per book, due to loss of goodwill. Up to 1000 of any leftover books can be sold to Barnes and Noble for 45 per book. The publisher is interested in maximizing expected profit. The following print-run sizes are under consideration: 0 (no production run) to 16,000 in increments of 2000. What decision would you recommend? Use simulation with 1000 replications. For your optimal decision, the publisher can be 90% certain that the actual profit associated with remaining sales of the current edition will be between what two values?The DC Cisco office is trying to predict the revenue it will generate next week. Ten deals may close next week. The probability of each deal closing and data on the possible size of each deal (in millions of dollars) are listed in the file P11_55.xlsx. Use simulation to estimate total revenue. Based on the simulation, the company can be 95% certain that its total revenue will be between what two numbers?
- Play Things is developing a new Lady Gaga doll. The company has made the following assumptions: The doll will sell for a random number of years from 1 to 10. Each of these 10 possibilities is equally likely. At the beginning of year 1, the potential market for the doll is two million. The potential market grows by an average of 4% per year. The company is 95% sure that the growth in the potential market during any year will be between 2.5% and 5.5%. It uses a normal distribution to model this. The company believes its share of the potential market during year 1 will be at worst 30%, most likely 50%, and at best 60%. It uses a triangular distribution to model this. The variable cost of producing a doll during year 1 has a triangular distribution with parameters 15, 17, and 20. The current selling price is 45. Each year, the variable cost of producing the doll will increase by an amount that is triangularly distributed with parameters 2.5%, 3%, and 3.5%. You can assume that once this change is generated, it will be the same for each year. You can also assume that the company will change its selling price by the same percentage each year. The fixed cost of developing the doll (which is incurred right away, at time 0) has a triangular distribution with parameters 5 million, 7.5 million, and 12 million. Right now there is one competitor in the market. During each year that begins with four or fewer competitors, there is a 25% chance that a new competitor will enter the market. Year t sales (for t 1) are determined as follows. Suppose that at the end of year t 1, n competitors are present (including Play Things). Then during year t, a fraction 0.9 0.1n of the company's loyal customers (last year's purchasers) will buy a doll from Play Things this year, and a fraction 0.2 0.04n of customers currently in the market ho did not purchase a doll last year will purchase a doll from Play Things this year. Adding these two provides the mean sales for this year. Then the actual sales this year is normally distributed with this mean and standard deviation equal to 7.5% of the mean. a. Use @RISK to estimate the expected NPV of this project. b. Use the percentiles in @ RISKs output to find an interval such that you are 95% certain that the companys actual NPV will be within this interval.You now have 10,000, all of which is invested in a sports team. Each year there is a 60% chance that the value of the team will increase by 60% and a 40% chance that the value of the team will decrease by 60%. Estimate the mean and median value of your investment after 50 years. Explain the large difference between the estimated mean and median.Software development is an inherently risky and uncertain process. For example, there are many examples of software that couldnt be finished by the scheduled release datebugs still remained and features werent ready. (Many people believe this was the case with Office 2007.) How might you simulate the development of a software product? What random inputs would be required? Which outputs would be of interest? Which measures of the probability distributions of these outputs would be most important?
- In Example 11.1, the possible profits vary from negative to positive for each of the 10 possible bids examined. a. For each of these, use @RISKs RISKTARGET function to find the probability that Millers profit is positive. Do you believe these results should have any bearing on Millers choice of bid? b. Use @RISKs RISKPERCENTILE function to find the 10th percentile for each of these bids. Can you explain why the percentiles have the values you obtain?A common decision is whether a company should buy equipment and produce a product in house or outsource production to another company. If sales volume is high enough, then by producing in house, the savings on unit costs will cover the fixed cost of the equipment. Suppose a company must make such a decision for a four-year time horizon, given the following data. Use simulation to estimate the probability that producing in house is better than outsourcing. If the company outsources production, it will have to purchase the product from the manufacturer for 25 per unit. This unit cost will remain constant for the next four years. The company will sell the product for 42 per unit. This price will remain constant for the next four years. If the company produces the product in house, it must buy a 500,000 machine that is depreciated on a straight-line basis over four years, and its cost of production will be 9 per unit. This unit cost will remain constant for the next four years. The demand in year 1 has a worst case of 10,000 units, a most likely case of 14,000 units, and a best case of 16,000 units. The average annual growth in demand for years 2-4 has a worst case of 7%, a most likely case of 15%, and a best case of 20%. Whatever this annual growth is, it will be the same in each of the years. The tax rate is 35%. Cash flows are discounted at 8% per year.An automobile manufacturer is considering whether to introduce a new model called the Racer. The profitability of the Racer depends on the following factors: The fixed cost of developing the Racer is triangularly distributed with parameters 3, 4, and 5, all in billions. Year 1 sales are normally distributed with mean 200,000 and standard deviation 50,000. Year 2 sales are normally distributed with mean equal to actual year 1 sales and standard deviation 50,000. Year 3 sales are normally distributed with mean equal to actual year 2 sales and standard deviation 50,000. The selling price in year 1 is 25,000. The year 2 selling price will be 1.05[year 1 price + 50 (% diff1)] where % diff1 is the number of percentage points by which actual year 1 sales differ from expected year 1 sales. The 1.05 factor accounts for inflation. For example, if the year 1 sales figure is 180,000, which is 10 percentage points below the expected year 1 sales, then the year 2 price will be 1.05[25,000 + 50( 10)] = 25,725. Similarly, the year 3 price will be 1.05[year 2 price + 50(% diff2)] where % diff2 is the percentage by which actual year 2 sales differ from expected year 2 sales. The variable cost in year 1 is triangularly distributed with parameters 10,000, 12,000, and 15,000, and it is assumed to increase by 5% each year. Your goal is to estimate the NPV of the new car during its first three years. Assume that the company is able to produce exactly as many cars as it can sell. Also, assume that cash flows are discounted at 10%. Simulate 1000 trials to estimate the mean and standard deviation of the NPV for the first three years of sales. Also, determine an interval such that you are 95% certain that the NPV of the Racer during its first three years of operation will be within this interval.
- In August of the current year, a car dealer is trying to determine how many cars of the next model year to order. Each car ordered in August costs 20,000. The demand for the dealers next year models has the probability distribution shown in the file P10_12.xlsx. Each car sells for 25,000. If demand for next years cars exceeds the number of cars ordered in August, the dealer must reorder at a cost of 22,000 per car. Excess cars can be disposed of at 17,000 per car. Use simulation to determine how many cars to order in August. For your optimal order quantity, find a 95% confidence interval for the expected profit.You have 5 and your opponent has 10. You flip a fair coin and if heads comes up, your opponent pays you 1. If tails comes up, you pay your opponent 1. The game is finished when one player has all the money or after 100 tosses, whichever comes first. Use simulation to estimate the probability that you end up with all the money and the probability that neither of you goes broke in 100 tosses.Based on Marcus (1990). The Balboa mutual fund has beaten the Standard and Poors 500 during 11 of the last 13 years. People use this as an argument that you can beat the market. Here is another way to look at it that shows that Balboas beating the market 11 out of 13 times is not unusual. Consider 50 mutual funds, each of which has a 50% chance of beating the market during a given year. Use simulation to estimate the probability that over a 13-year period the best of the 50 mutual funds will beat the market for at least 11 out of 13 years. This probability turns out to exceed 40%, which means that the best mutual fund beating the market 11 out of 13 years is not an unusual occurrence after all.