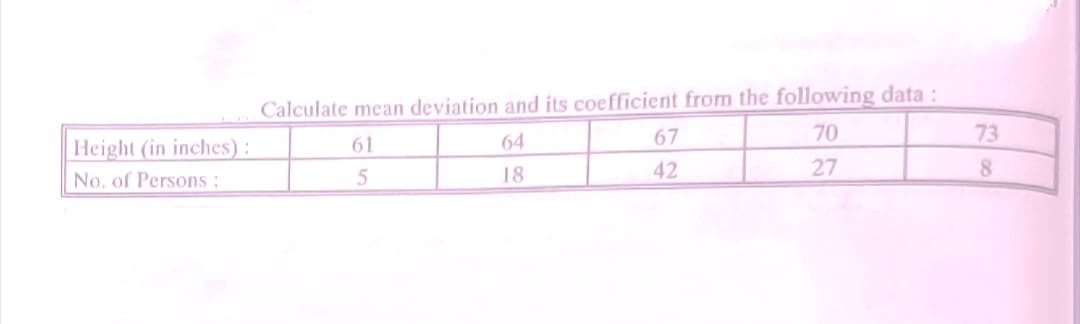
Calculate mean deviation and its coefficient from the following data: 73 64 67 70 Height (in inches): 61 No. of Persons: 18 42 27 8.


Q: Calculate coefficient of quartile deviation and coefficient of variation from the following data…
A:
Q: . Calculate standard deviation and coefficient of variation from the data given below: Mid-points :…
A:
Q: 2. We are given data 124 ; 58 ; 215 ; 123 ; 79 ; 68 ; 82 ; 130 ; 128 ; 150 132 ; 69 ; 132 ; 115 ;…
A:
Q: Calculate the mean deviation and its coefficient from the following data : Class Frequency Class…
A: Given that data I want to find coefficients of mean deviation. Mean = sum of all…
Q: Calculate the mean and standard deviation from the sample data below. 23-41 1 42-60 5. 61 79 80-98…
A: Given data is: class frequency(f) midpoint(x) 23-41 1 32 42-60 5 51 61-79 7 70 80-98 10…
Q: For the following data obtain (i) mean, (ii) median, (iii) mean deviation from median, and (iv) the…
A:
Q: Calculate the arithmetic mean and standard deviation from the following data : Value Frequeucy. 14…
A:
Q: Find the standard deviation and coefficient of variation from the following data: Marks No. of…
A:
Q: Please explain and interpret each of the following descriptive statistics for the variable shown in…
A: Following is the descriptive statistics of the data on child weight.
Q: Q. 8. Calculate the mean from the following data: Marks below : 10 20 30 40 50 No. of students : 15…
A:
Q: Match the histograms on the right to the summary statistics given. Standard Mean Median Deviation 53…
A: Histogram : A bar graph may be a graphical illustration that divides a group of information points…
Q: The following data relate to the age of a group of Govt. employees. Calculate the arithmetic mean…
A: Class Frequency (f) Mid value (x) d=X-Ahd=X-37.55A=37.5 , h=5 f⋅d f⋅d2 20 - 25 170 22.5 -3…
Q: 3. The data on relative humidity (in %) for the first ten days of the month in a city are given…
A:
Q: In my homework assignment, I have a concern about standard deviation do I have to round it to two…
A: Rounding-off must always be done as per the instruction in the question. In the absence of an…
Q: Calculate the coefficient of variation t
A: Our aim is to find the coefficient of variation. From the given data : n=5 , ƩX=140 , ƩX2=4038
Q: Use the data to answer the following questions: 10; 11; 15; 15; 17; 22 What number is two standard…
A:
Q: The upper 50% of the data on this graph is within how many standard deviations from the mean?…
A: Given graph: The histogram indicates the distribution is approximately normally distributed.
Q: The mean number of birth of babies over a 5 month period in Ibri is 111 and the coefficient of…
A: Measure of central tendency measure the central or average value of a dataset. Measured of…
Q: The following data are the distances between a sample of 20 retail stores and a large distribution…
A:
Q: Compute for the population mean, population variance and population standard deviation. The IQ of 8…
A:
Q: The following data relate to the age of a group of Govt. employees Calculate the arithmetic mean and…
A: Given Data in ascending order : Age groups Number of employees (f) 20-25 170 25-30 110…
Q: Calculate mean deviation (take deviation from mean) from the following data : x 2 4 6 Ĵ 1 4 6 8 10 4…
A:
Q: Calculate mean deviation from the following data: Marks less than : 80 70 30 10 60 50 40 20 No. of…
A:
Q: Calculate the mean and standard deviation for the following distribution : *: 25 35 45 55 65 75 85…
A:
Q: If a data set has a mean of 80 and a standard deviation of 10, calculate +1.5 standard deviations…
A: Given : data set has a mean of 80 and a standard deviation of 10
Q: Calculate the mean deviation and its coefficient from the following data : Class Frequency Class…
A:
Q: b- Find out which is more dispersion variable (X) or variable (Y). if the Arithmetic Mean and the…
A:
Q: Calculate standard deviation and its coefficient of variation from the following data : Measurements…
A: Class Frequency (f) Mid value (x) f⋅x f⋅x2 0-5 4 2.5 10 25 5-10 1 7.5 7.5 56.25 10-15 10…
Q: Calculate mean deviation from median from the following data : Marks less than No. of Students 80 70…
A:
Q: Q 1-From the following data, calculate Standard Deviation marks 15 25 35 45 55 No. of student 10 20…
A: Given data is Marks No. of students 5 10 15 20 25 30 35 50 45 40 55 30
Q: Find Mean Deviation and its Coefficient from Median from the following data : Classes: 0-10 10-20…
A: Dispersion is used to measure the spread of data from the individual values from the measure of…
Q: 4. Compute the average deviation on the data below Test scores X-Х bar Xi 57 60 65 70 78 s0 82 85…
A: 4. Formula for Average deviation is, Average deviation=∑x'n Where x'=x-x¯ x¯=∑xin , n=10…
Q: 1. Find Mean, Standard Deviation, Third quantile, 21st Percentile, and 87th Percentile for the data…
A: Given: Population size N = 8 Formula Used: Mean X = 1N∑i=1nXi Standard deviation σ = ∑Xi-X2N Third…
Q: Find Standard Deviation for the following frequency distribution 10 11 12 13 14 Total 3 12 18 12 48
A:
Q: A Calculate the mean deviation and its coefficient from the following data: Class AnFrequency…
A: Here, N= 92 , let A = 45 , class size (h) = 10 Mid value (x) = (lower class - upper class)…
Q: Calculate Quartile Deviation and coefficient of Quartile Deviation from the following data : Age in…
A:
Q: The following data are the distances between a sample of 20 retail stores and a large distribution…
A: The size of the observation is n = 20.
Q: Find the mean and the mean deviation about mean from the following frequency distribution : Weight…
A: Dispersion measure the spread of the observation from central tendency measures. There are some…
Q: a) Calculate the Median, Mode and standard deviation of the following data 71 Weights 63 65 66 67 68…
A: Let xi be the value and fi be the frequency associated with value xi . Weights (xi) 63 64 65 66…
Q: Calculate the mean and standard deviation from the following data: 60-69 Value: 90-99 80-89 70-79…
A: Class Frequency (f) Mid value (x) f⋅x f⋅x2 30-39 1 34.5 34.5 1190.25 40-49 4 44.5 178…
Q: Calculate the arithmetic mean and standard deviation from the following data : Value Frequency Value…
A:
Q: The mean number of birth of babies over a 7 month period in Ibri is 106 and the coefficient of…
A: Since you have asked multiple question, we will solve the first question for you. If you want any…
Q: Calculate the mean deviation and its coefficient both from mean and median for the following. Marks:…
A:
Q: a) For the following calculate mean deviation using median. Height No. of Boys 55 56 57 58 59 60 25…
A: Given Height No of boys 55 25 56 40 57 50 58 20 59 10 60 5
Q: For the data shown, answer the questions. Round to 2 decimal places. 27.8 24.3 22 9.3 28.2 27.2 3.1…
A: Mean = 21.28
Q: 5. The following values are the number of customers a restaurant served for lunch on ten consecutive…
A: Here, x (x-x) (x-x)2 46 -14.4 207.36 49 -11.4 129.96 51 -9.4 88.36 60 -0.4 0.16 63 2.6…
Q: The coefficient of variation for a data set is the mean divided by the standard deviation, expressed…
A: The provided statement is "False".
Q: For the following data obtain () mean, (ii) median, (i) mean deviation from median, and (iv) the…
A:
Q: 3. The data on relative humidity (in %) for the first ten days of the month in a city are given…
A: Since you have asked multiple questions, we will solve the first question for you. If you want any…
Q: Calculate the average (mean) of the data shown, to two decimal places x 7.1, 11.1, 24, 15.4 ,3.4,…
A: We have given the following data X : 7.1, 11.1, 24, 15.4 ,3.4, 13.2, 20.1, 21.6

Step by step
Solved in 2 steps with 1 images
