The upper 50% of the data on this graph is within how many standard deviations from the mean? Distribution of Diastolic Blood Pressure 160 140 120 100 80 60 40 20 64 66 68 70 72 74 76 78 80 82 84 86 88 90 92 94 96 98 Age Frequency (in thousands)
The upper 50% of the data on this graph is within how many standard deviations from the mean? Distribution of Diastolic Blood Pressure 160 140 120 100 80 60 40 20 64 66 68 70 72 74 76 78 80 82 84 86 88 90 92 94 96 98 Age Frequency (in thousands)

Glencoe Algebra 1, Student Edition, 9780079039897, 0079039898, 2018
18th Edition
ISBN:9780079039897
Author:Carter
Publisher:Carter
Chapter10: Statistics
Section10.3: Measures Of Spread
Problem 23PFA

Related questions
Question
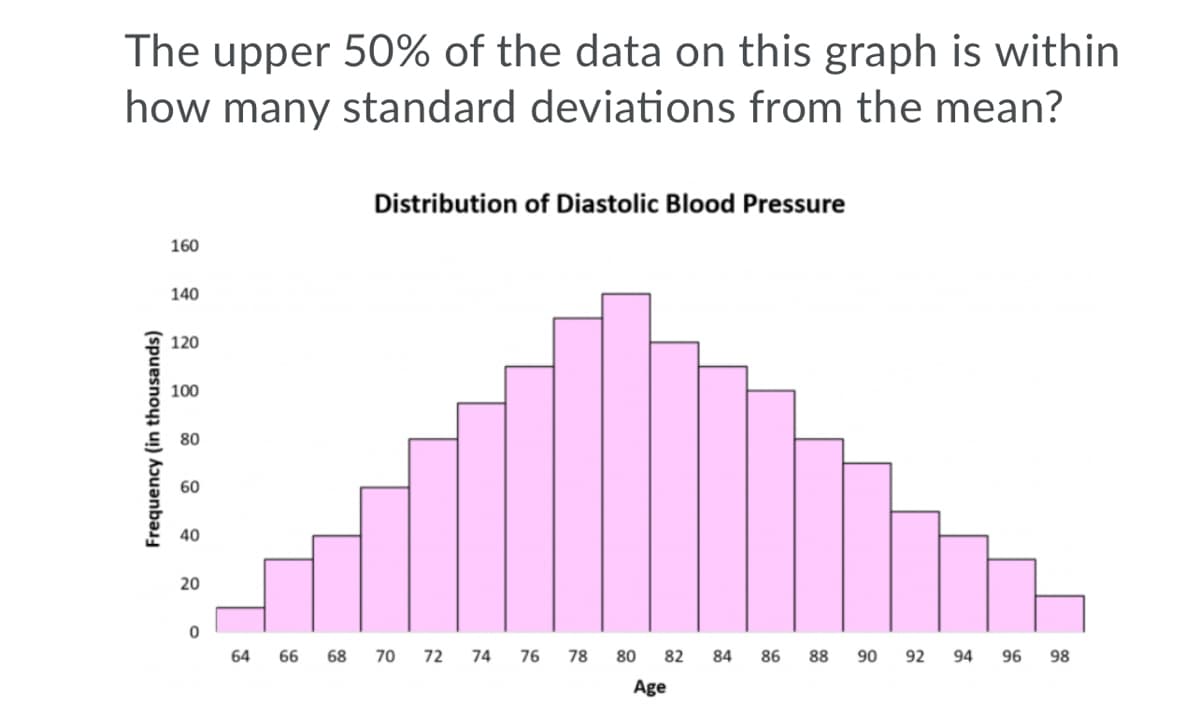
Transcribed Image Text:The upper 50% of the data on this graph is within
how many standard deviations from the mean?
Distribution of Diastolic Blood Pressure
160
140
120
100
80
60
40
20
64
66
68
70 72 74
76
78
80
82
84
86
88
90
92
94
96
98
Age
Frequency (in thousands)
Expert Solution
This question has been solved!
Explore an expertly crafted, step-by-step solution for a thorough understanding of key concepts.

This is a popular solution!

Trending now
This is a popular solution!

Step by step
Solved in 2 steps with 1 images

Recommended textbooks for you
Glencoe Algebra 1, Student Edition, 9780079039897…
Algebra
ISBN:
9780079039897
Author:
Carter
Publisher:
McGraw Hill
Glencoe Algebra 1, Student Edition, 9780079039897…
Algebra
ISBN:
9780079039897
Author:
Carter
Publisher:
McGraw Hill