Calculate the 13th and 64th percentiles of the data set shown below. 29 18 3 12 17 28 23 21 22 P13 This means that approximately 13 O % of the data lie at or below when the data are ranked. P64 when the data are O% of the data lie at or below This means that approximately 64 ranked. Question Help: A Read Submit Question
Calculate the 13th and 64th percentiles of the data set shown below. 29 18 3 12 17 28 23 21 22 P13 This means that approximately 13 O % of the data lie at or below when the data are ranked. P64 when the data are O% of the data lie at or below This means that approximately 64 ranked. Question Help: A Read Submit Question

Glencoe Algebra 1, Student Edition, 9780079039897, 0079039898, 2018
18th Edition
ISBN:9780079039897
Author:Carter
Publisher:Carter
Chapter10: Statistics
Section10.5: Comparing Sets Of Data
Problem 14PPS

Related questions
Question
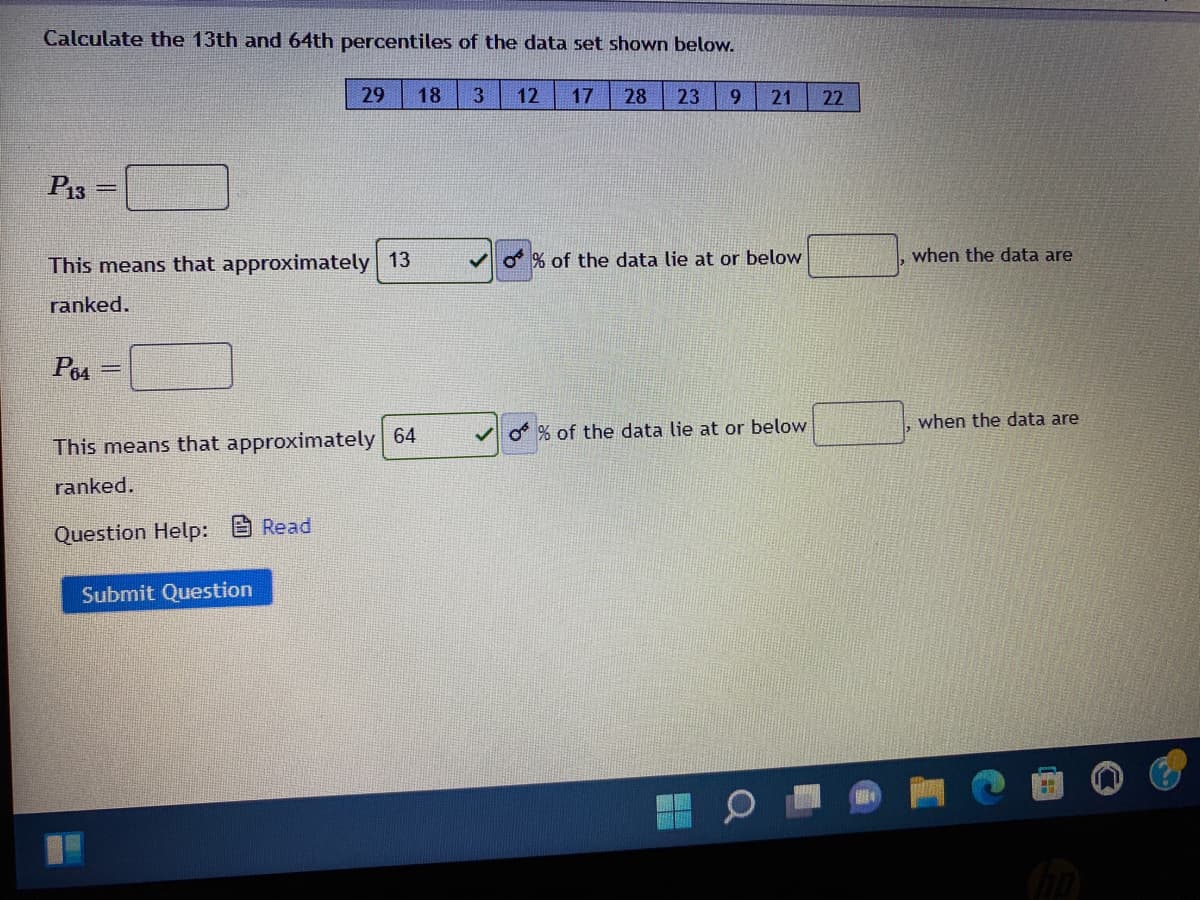
Transcribed Image Text:Calculate the 13th and 64th percentiles of the data set shown below.
29
18
3
12
17
28
23
6.
21
22
P13
This means that approximately 13
O % of the data lie at or below
when the data are
ranked.
P64
when the data are
O% of the data lie at or below
This means that approximately 64
ranked.
Question Help:
A Read
Submit Question
Expert Solution
This question has been solved!
Explore an expertly crafted, step-by-step solution for a thorough understanding of key concepts.

This is a popular solution!

Trending now
This is a popular solution!

Step by step
Solved in 2 steps with 2 images

Recommended textbooks for you
Glencoe Algebra 1, Student Edition, 9780079039897…
Algebra
ISBN:
9780079039897
Author:
Carter
Publisher:
McGraw Hill
Glencoe Algebra 1, Student Edition, 9780079039897…
Algebra
ISBN:
9780079039897
Author:
Carter
Publisher:
McGraw Hill