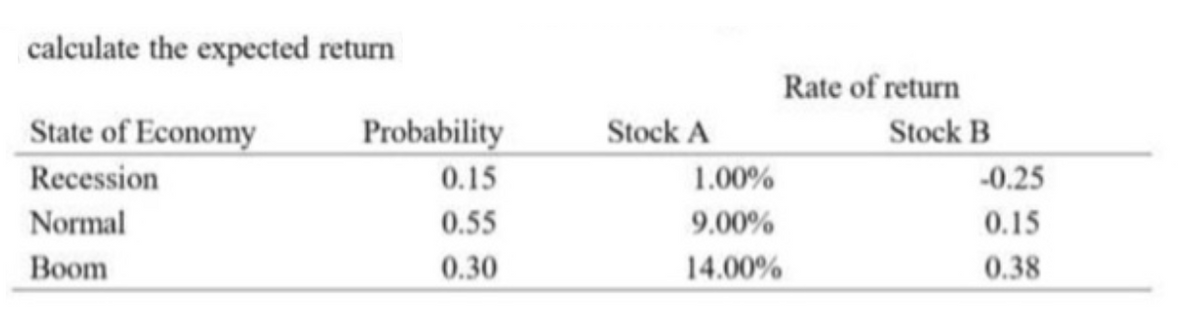
calculate the expected return Rate of return State of Economy Recession Probability Stock A Stock B 0.15 1.00% -0.25 Normal 0.55 9.00% 0.15 Boom 0.30 14.00% 0.38


Q: Quantitative Problem: You are given the following probability distribution for CHC Enterprises:…
A: An investor uses measures such as expected return, standard deviation, and coefficient of variation…
Q: Return if State Occurs Probability of State State of Economy Stock A Stock B Bust .10 -.12 -.05…
A: The table is: State of economy Probability of state Stock A Stock B Bust 0.1 -0.12 -0.05…
Q: The risk-free rate is 4.15 percent. What is the expected risk premium on this stock given the…
A: Investors have different options to make investments, and the motive behind investments is to…
Q: Find the expected return. State of the Economy Probability of State Occurring Stock's Expected…
A: The table is: State of the economy Probability of state occurring Stock's expected return Boom…
Q: The returns on the common stock of New Image Products are quite cyclical. In a boom economy, the…
A: Information in problem Economy Return Probability Boom 23% 60% Normal 14% 22% Recession…
Q: LO 1 7. Calculating Returns and Standard Deviations Based on the following information, calculate…
A: Expected rate of return is the profit or loss on the investor that is assumed to be anticipated by…
Q: State of Economy Boom Recession Probability of State Economy 40.00% 60.00% Rate of Return if State…
A: Expected return of each stock is: Expected ReturnStock=∑Probabilityeach state×Returneach state…
Q: Mystery Motors, Inc. stock has the following forecasted returns for various states of the economy:…
A: Here, To Find: Standard deviation =?
Q: Quantitative Problem: You are given the following probability distribution for CHC Enterprises:…
A: Expected Return is the amount of loss or profit an investor expects to receive on an investment.…
Q: a. What is the rate of return on the portfolio in each scenario? (Enter your answer as a percent…
A: Expected return refers to the investor’s predicted amount of profit and loss on an investment.…
Q: Consider the following information: Rate of Return If State Occurs State of Probability of State of…
A: Portfolio return is calculated by weighted average return of the stocks. Portfolio Return Rp = Wa*Ra…
Q: Use the following information on states of the economy and stock returns to calculate the expected…
A: The expected return can be computed by multiplying the probability of the state of the economy and…
Q: beta
A: Formula to calculate portfolio beta is: Portfolio beta = wA*Beta A + wB*Beta B +......+wN*Beta N…
Q: Estimated rate of returns T- Pak Market State of the Probability Blls Nescom Nawab PK_Steel…
A: 1. T-bills are short-term government securities, sold by the central bank on behalf of the…
Q: Consider the following information: Rate of Return If State Occurs Probability of State of State of…
A: Solution:
Q: 4. Based on the following information Calculate Rate of Return if State Occurs Stock B State of…
A: Standard deviation represents the measurement of variation in the amount of values.
Q: State of Economy Probability of State of Economy Rate of Return if State Occurs Stock A Stock B…
A: d) Expected return of the portfolio:(Ba×Pa)+(Bb×Pb)Where,Ba=Beta of stock A Bb=Beta of stock…
Q: onsider the following information: Probability of State of Economy Rate of Return if St Occurs Stoc…
A: Expected return of the stock depends the return under the probabilistic scenario of the different…
Q: Factor Models Suppose a three-factor model is appropriate to describe the returns of a stock.…
A: Given:
Q: Rate of Return if State Occurs Stock State of Economy Probability of State of Economy Stock A Stock…
A: Here, probability of each state and their rtun for each stock is given. Also, weight of each stock…
Q: Consider the following scenario analysis: Rate of Return Bonds 19% 9% Scenario Probability Stocks…
A: expected rate of return for stocks = 0.20 * (-0.04) +0.40 *(0.20) +0.40 * (0.26)…
Q: Stock A has the following returns for various states of the economy: State of the Economy…
A: Expected Return = Sum of All probability*return
Q: a. Calculate the expected return for Stocks A and B. (Do not round intermediate calculations and…
A: Expected return refers to the return earn by an investor on the amount invested during a period of…
Q: Calculate the expected rate of return and standard deviation for each investment.…
A: Expected return refers to the investor’s predicted amount of profit and loss on an investment.…
Q: Use the following information to calculate your company's expected return. State…
A: Expected return refers to the investor’s predicted amount of profit and loss on an investment.…
Q: Consider the following scenario analysis: Scenario Probability…
A: Expected return refers to the investor’s predicted amount of profit and loss on an investment.…
Q: State of Economy Probability ABC Company Expected Return Expected Return XYZ Company Very Poor 0.30…
A: Solution : Co-Variance is calculated as follows. Co-Variance : Dx * Dy / N…
Q: Consider the following scenario analysis: Rate of Return Scenario Probability Stocks Bonds…
A: Expected Return is average return that investor can earn considering different probabilities and…
Q: - Suppose your expectations regarding the stock price are as follows: Selling price = 100 T-bills =…
A: Expected rate of return is the profit or loss on the investor that is assumed to be anticipated by…
Q: Returns State of Economy Prob J K Recession 0.25 -0.02 0.034 Normal 0.6 0.138 0.062…
A: Since you have asked multiple question, we will solve the first question for you. If you want any…
Q: Calculate the expected return and standard deviation
A: A well-informed investor will obviously want to know the expected return of your portfolio—its…
Q: What is the expected return for the following stock? State Probability Return Average 50 .25…
A: Expected return is the return expressed in terms of percentages that is expected to be received for…
Q: Consider the folloving scenario analysis: Rate of Return Scenario Recession Probability Stocks Bonds…
A: Formulas:
Q: Question 7 You expect that the likelihood of economic recession and boom is 20% and 80%…
A: Hi There, thanks for posting the question. But as per Q&A guidelines, we must answer the first…
Q: Consider the following scenario analysis: Rate of Return Scenario Probability Stocks…
A: Part a: During recession period the price of bonds decreases, bond prices and bond returns are…
Q: Consider the following scenario analysis: Rate of Return Scenario Recession Normal economy…
A: To Find:- Expected Return Standard Deviation
Q: Consider the following scenario analysis: Rate of Return Stocks Bonds Scenario Recession Probability…
A: The expected return is calculated by multiplying the return by probability. Expected Return =…
Q: State of Economy Probability of State of Economy Rate of Return if State Occurs Stock A Stock B…
A: we will only answer the first three subparts. For the remaining subparts, kindly resubmit the…
Q: What is the standard deviation of the returns on a stock given the following information? State of…
A: Given data is - State of Economy Probability of state of economy Returns Recession 0.05 6%…
Q: Rate of Return Scenario Recession Normal economy Probability Stocks Bonds 15% 0.2 -4% 0.7 16 11 Boom…
A: Rate of Return = Probability * Expected Return
Q: State of economy Probability Rate of returns Stock A Stock B Stock C Boom 0.35 0.24 0.36 0.55…
A:
Q: Consider the following data State of Nature Prob. Stock A Return Boom 0.3 16.00% Normal 0.6 14.20%…
A: Expected return can be calculated by multiplying the probability with rate of return. Expected…
Q: An analyst has estimated how a particular stock’s return will vary depending on what will happen to…
A: The coefficient of variation is the standard deviation of the returns of the stock divided by the…
Q: tock W has the following returns for various states of the economy: State of the Economy…
A: Stock W return = (Probability 1 * Return 1) + (Probability 2* Return 2) + ....+ (Probability N *…
Q: State of economy Probability Rate of returns Stock A Stock B Stock C Boom 0.35 0.24 0.36 0.55…
A: Given data; State of economy Probability Rate of returns Stock A Stock B Stock C Boom…
Q: Consider the following scenario analysis: Rate of Return Scenario Probability Stocks Bonds…
A: Yes. It is reasonable to assume that Treasury bonds will provide higher returns in recessions than…


Trending now
This is a popular solution!

Step by step
Solved in 2 steps

- The following table provides information relating to Omega Ltd, as well as the market portfolio. The risk-free rate of return is 3.4% . Asset Excess Return Variance Beta Omega 12% 0.021904 1.4 M 8.1% 0.010201 1 What is Omega's M2 value? a. 7.41% b. 11.59% c. 8.99% d. 9.27% What is Omega's Sharpe Ratio? a. 0.061 b. 0.811 c. 0.086 d. 0.581 please explain the calculation step by stepConsider the following information about the various states of economy and the returns ofvarious investment alternatives for each scenario. Answer the questions that follow.% Return on T-Bills, Stocks and MarketIndexState of the Economy Probability TBills Phillips PayupRubbermadeMarketIndexRecession 0.2 7 -22 28 10 -13Below Average 0.1 7 -2 14.7 -10 1Average 0.3 7 20 0 7 15Above Average 0.3 7 35 -10 45 29Boom 0.1 7 50 -20 30 43MeanStandard DeviationCoefficient of VariationCovariance with MPCorrelation with Market IndexBetaCAPM Req. ReturnValuation(Overvalued/Undervalued/FairlyValued)Nature of stock(Aggressive/Defensive)Question 1 Fill the parts in the above table that are shaded in yellow. You will notice that there are nineline items. Each line item is worth 2 marksQuestion 2 Using the data generated in the previous question (Question 1);a) Plot the Security Market Line (SML) b) Superimpose the CAPM’s required return on the SML c) Indicate which investments will plot on, above and…Consider the following information about the various states of economy and the returns ofvarious investment alternatives for each scenario. Answer the questions that follow.% Return on T-Bills, Stocks and MarketIndexState of the Economy Probability TBills Phillips PayupRubbermadeMarketIndexRecession 0.2 7 -22 28 10 -13Below Average 0.1 7 -2 14.7 -10 1Average 0.3 7 20 0 7 15Above Average 0.3 7 35 -10 45 29Boom 0.1 7 50 -20 30 43MeanStandard DeviationCoefficient of VariationCovariance with MPCorrelation with Market IndexBetaCAPM Req. ReturnValuation(Overvalued/Undervalued/FairlyValued)Nature of stock(Aggressive/Defensive)Question 1 Fill the parts in the above table that are shaded in yellow. You will notice that there are nineline items. Question 2 Using the data generated in the previous question (Question 1);a) Plot the Security Market Line (SML) b) Superimpose the CAPM’s required return on the SML c) Indicate which investments will plot on, above and below the SML? d) If an…
- Your rate of retum expectations for the common stock of Company during the next year are: Possible Rate of Return Probability- 0.10 0.250.00 0.150.10 0.350.25 0.25 Required: Compute the expected return [E(R)] on this investment, the variance of this returm, and its standard deviationThe formula of which of the following considers the percentage change in price? a. Total expected yield b. Yield to date c. Present value yield d. Yield to maturityConsider the case of two financial assets and three market conditions (states). The tablebelow gives the respective probability for each market condition and the return of each assetin each one of them. Market Conditions State Recession Normal Expansion Probability of state 30% 40% 30% Return of asset A -30% 20% 55% Return of asset B -10% 70% 0% Consider the portfolio with 50% investment in each of the two assets above. Calculatethe expected return and the standard deviation of the portfolio.
- Consider a single-index model economy. The index portfolio M has E(RM ) = 6%, σM = 18%.An individual asset i has an estimate of βi = 1.1 and σ2ei = 0.0225 using the single index modelRi = αi + βiRM + ei. The forecast of asset i’s return is E(ri) = 12%. rf = 4%. a) According to asset i’s return forecast, calculate αi. (b) Calculate the optimal weight of combining asset i and the index portfolio M . (c) Calculate the Sharpe ratio of the index portfolio M and the portfolio optimally combiningasset i and the index portfolio M .The following data have been developed for the Donovan Company:Probability of Stateof NatureState of Nature Market Return, Rm Return for the Firm, Rj0.10 1 -0.15 -0.300.30 2 0.05 0.000.40 3 0.15 0.200.20 4 0.20 0.50The risk-free (Rf) rate is 6%.Calculate the following:(a) The covariance of the return for the Donovan Company with the marketreturn.(b) What is the required return for the Donovan Company? How does thiscompare with its expected return?free rate is 6%, find the beta for a portfolio that has expected rate of returnof 10%.(i). What percentage of this portfolio must an individual put into the marketportfolio in order to achieve an expected return of 10%?Consider the following information regarding a new investment that a company intends toundertake:.State of the Economy Probability Market Return Investment ReturnExpansion 0.30 40% 60%Normal 0.50 10% 25%Recession 0.20 -15% -40%a). Compute the variance and standard deviation of each b). Compute the correlation between the market the investment return(s) c). Compute the beta of the investment d). Assuming the risk free rate is 5% p.a. Compute the required rate return and advice if the investment is worth undertaken.
- YearRisk-free ReturnMarket ReturnWyatt Oil ReturnBeta20071.9%6.0%5.5%0.83320082.1%-38.5%-32.6%0.85320091.7%22.5%19.6%0.865 Using the average historical excess returns for both Wyatt Oil and the Market portfolio, your estimate of Wyatt Oil's beta is closest to (%) (2 decimal places):Consider the following information about the various states of economy and the returns ofvarious investment alternatives for each scenario. Answer the questions that follow. % Return on T-Bills, Stocks and Market IndexState of the Economy Probability TBills Phillips Payup Rubbermade Market Index Recession 0.2 7 -22 28 10 -13 Below Average 0.1 7 -2 14.7 -10 1 Average 0.3 7 20 0 7 15 Above Average 0.3 7 35…refer to below table ,Conduct a sensitivity analysis to determine the sensitivity of NPV to changes in the sales price, number of units sold, the variable costs per unit, fixed costs and the cost of capital. Set these variables’ values at 10% above and 10% below their base-case values. 2. Include a graph in your analysis with below table? 10% above Year Net Cash Flow (RM) Discount Rate (13.20%) Present Value (RM) 0 -1,217,800.00 1 -1217800 1 328,750.00 0.883392 290415.19 2 337,330.00 0.780382 263246.2 3 346,423.15 0.689383 238818.31 4 355,195.10 0.608996 216312.32 5 614,461.20 0.537982 330569.16 NPV 121561.19 10% below Year Net Cash Flow (RM) Discount Rate (10.80%) Present Value (RM) 0 -1,145,800.00 1 -1145800 1 184,000.00 0.902527 166064.98 2 185,395.00 0.814555 151014.45 3 189,459.85 0.735158 139282.93 4 193,936.89 0.6635 128677.14 5 448,143.25 0.598827 268360.17…
