Calculate the fitted y; for each value of x¡ used to fit the model. Then construct a graph of y; versus the correspon- ding observed value y, and comment on what this plot would look like if the relationship between y and x was a deterministic (no random error) straight line. Does the plot actually obtained indicate that taxes paid is an effec- tive regressor variable in predicting selling price?
Calculate the fitted y; for each value of x¡ used to fit the model. Then construct a graph of y; versus the correspon- ding observed value y, and comment on what this plot would look like if the relationship between y and x was a deterministic (no random error) straight line. Does the plot actually obtained indicate that taxes paid is an effec- tive regressor variable in predicting selling price?

MATLAB: An Introduction with Applications
6th Edition
ISBN:9781119256830
Author:Amos Gilat
Publisher:Amos Gilat
Chapter1: Starting With Matlab
Section: Chapter Questions
Problem 1P

Related questions
Question
100%
APPLIED STATISTICS
UPVOTE WILL BE GIVEN.
YOU MAY USE EXCEL OR IBM SPSS. PLEASE WRITE/TYPE THE COMPLETE SOLUTIONS. TAKE A SCREENSHOT IF EXCEL OR SPSS IS BEING USED.
An article in Technometrics by S. C. Narula and J. F. Wellington (“Prediction, Linear Regression, and a Minimum Sum of Relative Errors,” Vol. 19, 1977) presents data on the selling price (y) and annual taxes (x) for 24 houses. The taxes include local, school and county taxes. The data are shown in the table below. Calculate the least square estimates of slope and intercept.
Answer letter D.
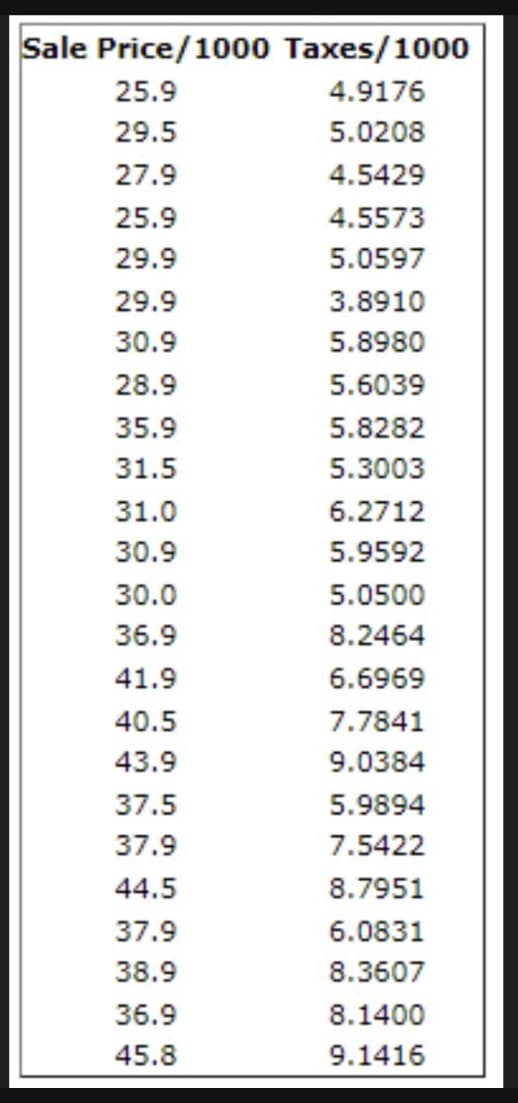
Transcribed Image Text:Sale Price/1000
25.9
29.5
27.9
25.9
29.9
29.9
30.9
28.9
35.9
31.5
31.0
30.9
30.0
36.9
41.9
40.5
43.9
37.5
37.9
44.5
37.9
38.9
36.9
45.8
Taxes/1000
4.9176
5.0208
4.5429
4.5573
5.0597
3.8910
5.8980
5.6039
5.8282
5.3003
6.2712
5.9592
5.0500
8.2464
6.6969
7.7841
9.0384
5.9894
7.5422
8.7951
6.0831
8.3607
8.1400
9.1416
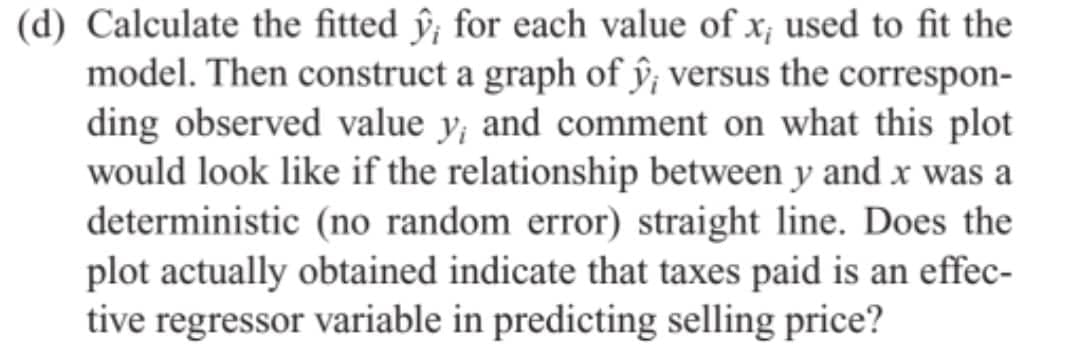
Transcribed Image Text:(d) Calculate the fitted ŷ; for each value of x, used to fit the
model. Then construct a graph of ŷ, versus the correspon-
ding observed value y, and comment on what this plot
would look like if the relationship between y and x was a
deterministic (no random error) straight line. Does the
plot actually obtained indicate that taxes paid is an effec-
tive regressor variable in predicting selling price?
Expert Solution
This question has been solved!
Explore an expertly crafted, step-by-step solution for a thorough understanding of key concepts.

Step by step
Solved in 2 steps with 3 images

Recommended textbooks for you
MATLAB: An Introduction with Applications
Statistics
ISBN:
9781119256830
Author:
Amos Gilat
Publisher:
John Wiley & Sons Inc

Probability and Statistics for Engineering and th…
Statistics
ISBN:
9781305251809
Author:
Jay L. Devore
Publisher:
Cengage Learning

Statistics for The Behavioral Sciences (MindTap C…
Statistics
ISBN:
9781305504912
Author:
Frederick J Gravetter, Larry B. Wallnau
Publisher:
Cengage Learning
MATLAB: An Introduction with Applications
Statistics
ISBN:
9781119256830
Author:
Amos Gilat
Publisher:
John Wiley & Sons Inc
Probability and Statistics for Engineering and th…
Statistics
ISBN:
9781305251809
Author:
Jay L. Devore
Publisher:
Cengage Learning
Statistics for The Behavioral Sciences (MindTap C…
Statistics
ISBN:
9781305504912
Author:
Frederick J Gravetter, Larry B. Wallnau
Publisher:
Cengage Learning

Elementary Statistics: Picturing the World (7th E…
Statistics
ISBN:
9780134683416
Author:
Ron Larson, Betsy Farber
Publisher:
PEARSON

The Basic Practice of Statistics
Statistics
ISBN:
9781319042578
Author:
David S. Moore, William I. Notz, Michael A. Fligner
Publisher:
W. H. Freeman

Introduction to the Practice of Statistics
Statistics
ISBN:
9781319013387
Author:
David S. Moore, George P. McCabe, Bruce A. Craig
Publisher:
W. H. Freeman